Using CartoDB and Odyssey.js for Making Story Maps
Contact me at stacemaples@stanford.edu
This tutorial has been written so that it is generic enough for anyone to easily create a story map using a free CartoDB account and Odyssey.js. The tutorial is written specifically to support a course at Stanford University, but is being made publicly available for the benefit of all. We like the FOSS4G ethos, here, and try to live it.
I'll be maching up information from various sources (Wikipedia, etc...) on the modern history of tattooing in San Francisco. Mostly because it's interesting, and there is plenty of material that is cool to look at. That said, I'm not a historian and this is not an authoritative map of that history (now that I think of it, that would be cool though). It's a tutorial on how to make a Story Map from CartoDB and Odyssey.js.
In This Tutorial, You Will Learn To:
- Create an empty CartoDB table
- Populate that table with fields for your data
- Add the data to your new empty table
- 'Geocode' your records so that they show up on the map
- Customize the Pop-up and Hover doo-dads
- Find your Map ID to put into Odyssey.js
- Use the Odyssey.js 'Sandbox' to create a basic Story Map
- Use an historic map from DavidRumsey.com as a basemap in your Story Map
- Share your Odyssey.js Story Map with a URL, Embed Code, or host it yourself.
What You Will Need Before Getting Started
- Something interesting to make a Story Map of!
- Information about the locations that make up your story
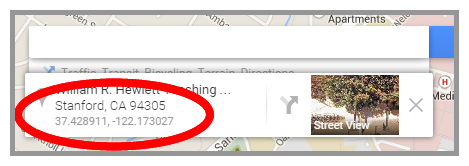
- The Latitude & Longitude of your locations (Go to Google Maps, find your location, right-click on it and select What's Here. You can cut-&-paste* the coordinates from the resulting info window)

- Links (URLs) to images
- Links (URLs) to more content
- Narrative text about your subject
- etc...
- The Latitude & Longitude of your locations (Go to Google Maps, find your location, right-click on it and select What's Here. You can cut-&-paste* the coordinates from the resulting info window)
- A CartoDB account. You can get a free one, here: CartoDB Free Account. If you have an .edu email address, you can get a slightly better one, here: CartoDB Academy Account
It Would Be Incredibly Helpful if You...
- Go through the following CartoDB Academy courses:
- Online Mapping for Beginners - Basic concepts of online mapping
- Introduction to Map Design - Master the basics of designing data for your maps!
- Learn more about MarkDown, which is the text /ing 'language' you will use to create the content in your Odyssey.js Story Map (It's also what this tutorial is written in!).
- Take a look at these pages from the w3schools.com:
- HTML img Tag - We'll use this to turn our image URL into the image in our pop-ups
- HTML a Tag - We'll use this to turn our Link URLs into actual links in our pop-ups
Getting Started with CartoDB
- Login to your CartoDB Account (if you don't have one, see above).
Create an Empty Map/Dataset
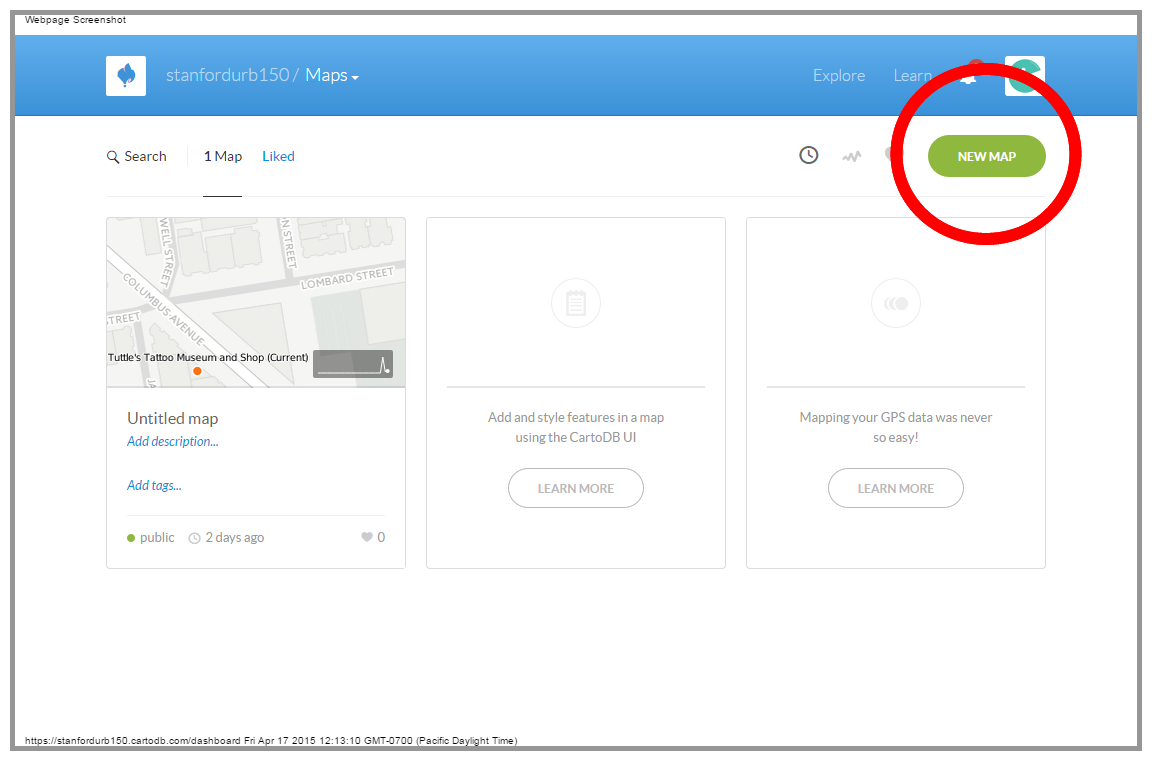
- Click on the New Map Button.
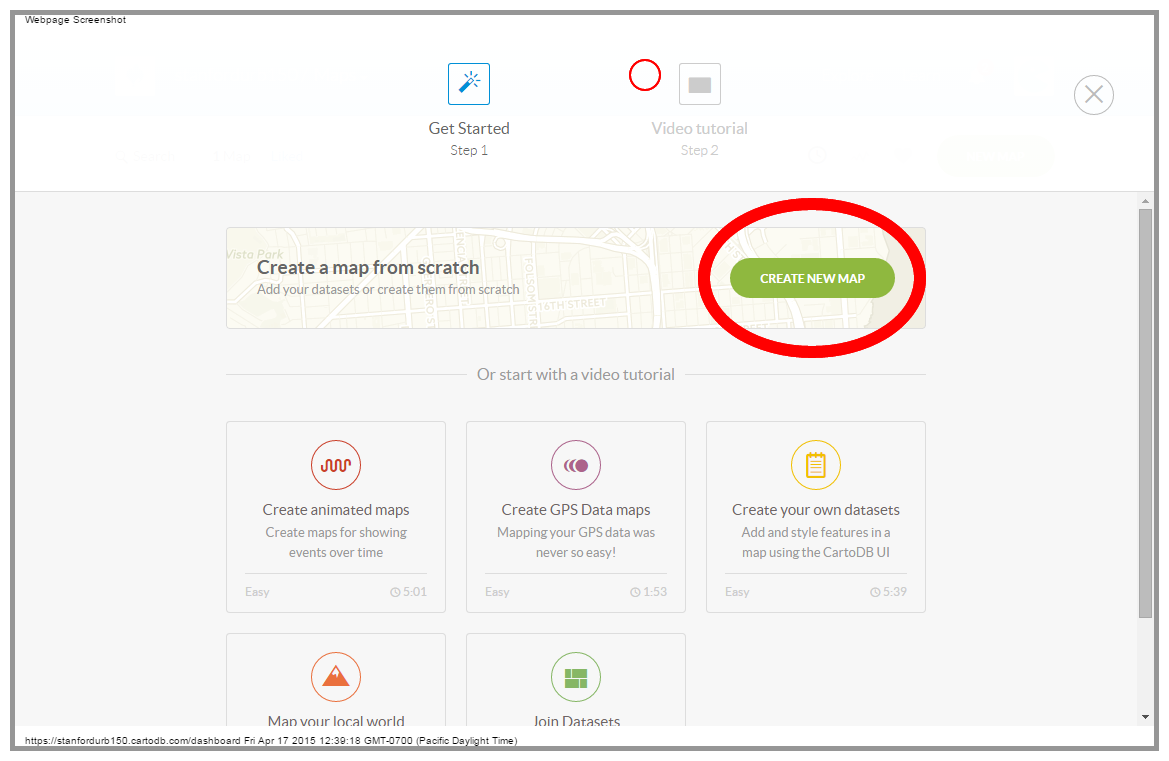
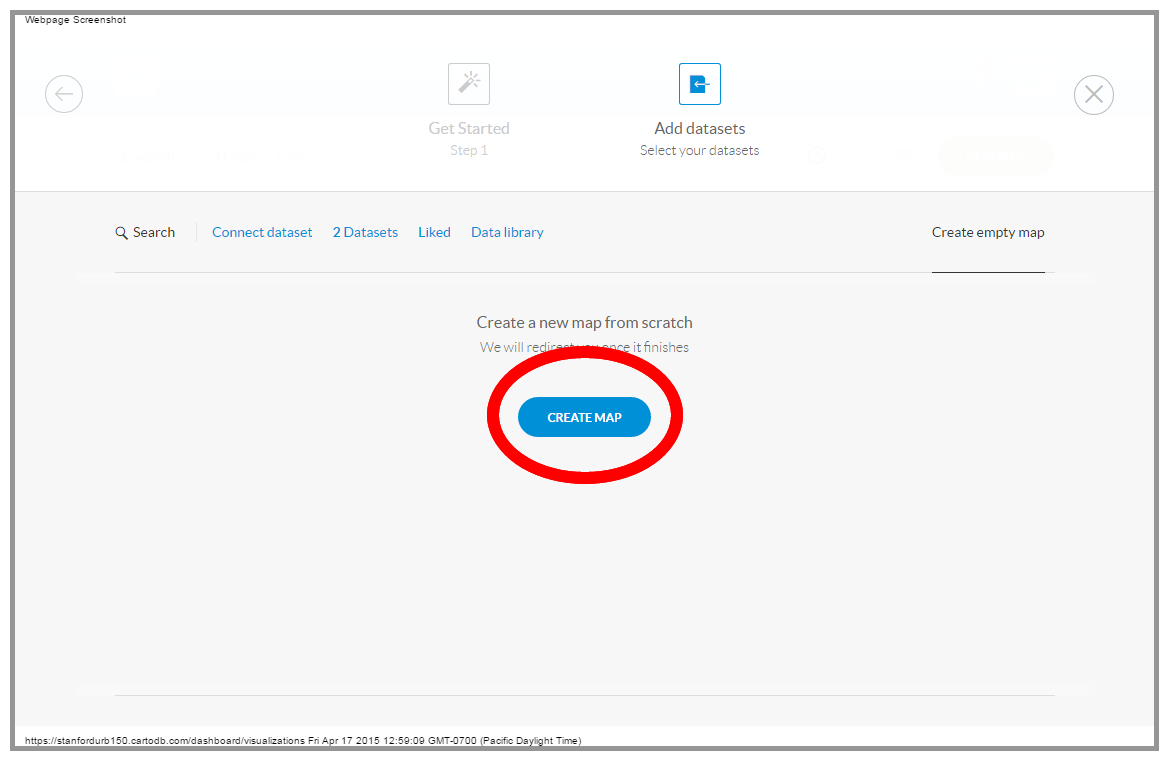
- Click on the Create New Map button
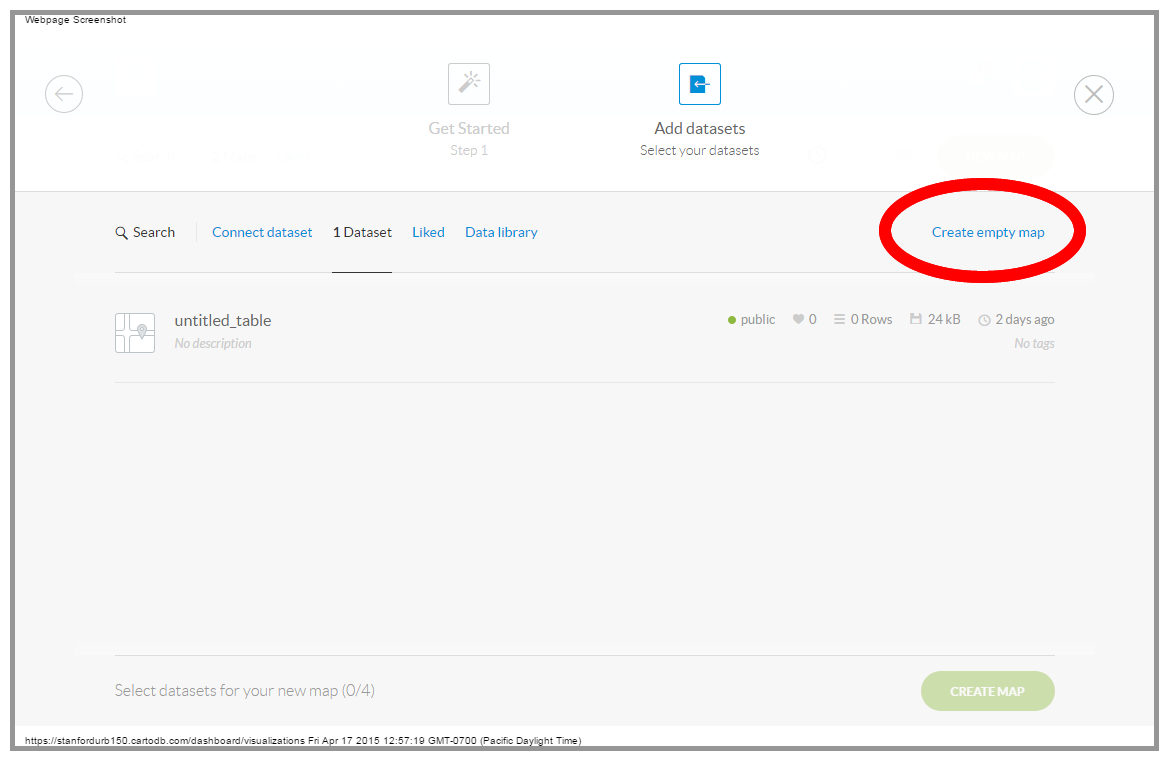
- Click on your untitled_map to highlight it and then click the Create Empty Map link at the top right of the page
- Click on yet another Create Map button...
Adding Fields to an Empty CartoDB Table
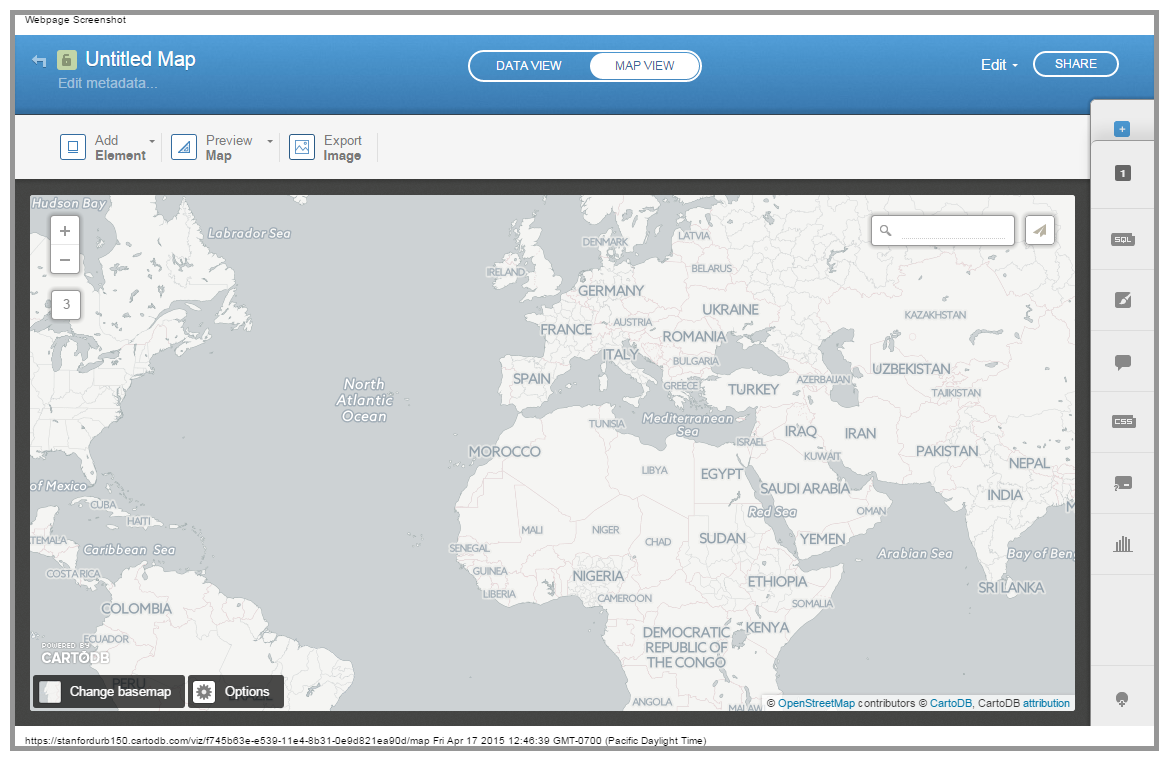 You should now see something like the image, above, with a basic CartoDB Basemap and the tools you need to begin building your map. You should have already gone through the CartoDB Academy Basic courses, so we won't go through all of the details, now. We're going to get right to work creating fields to hold our content. Let's get started...
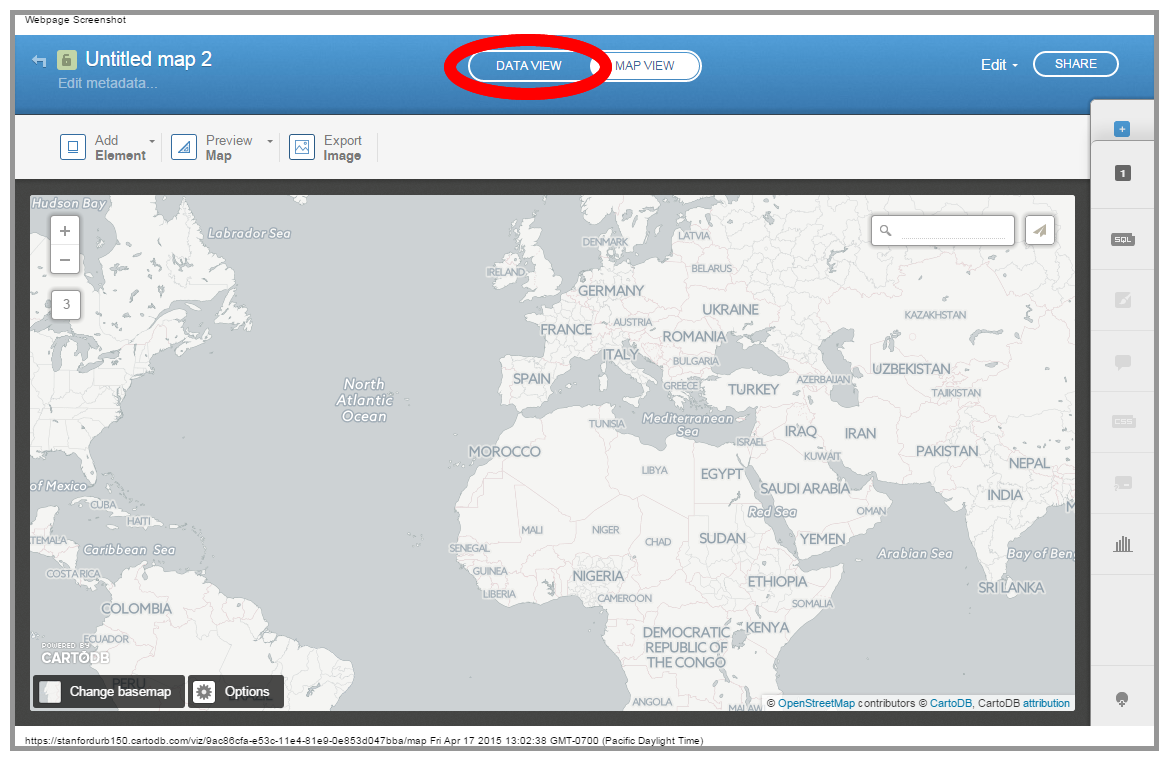
- Click on the Data View button at the top of the page...
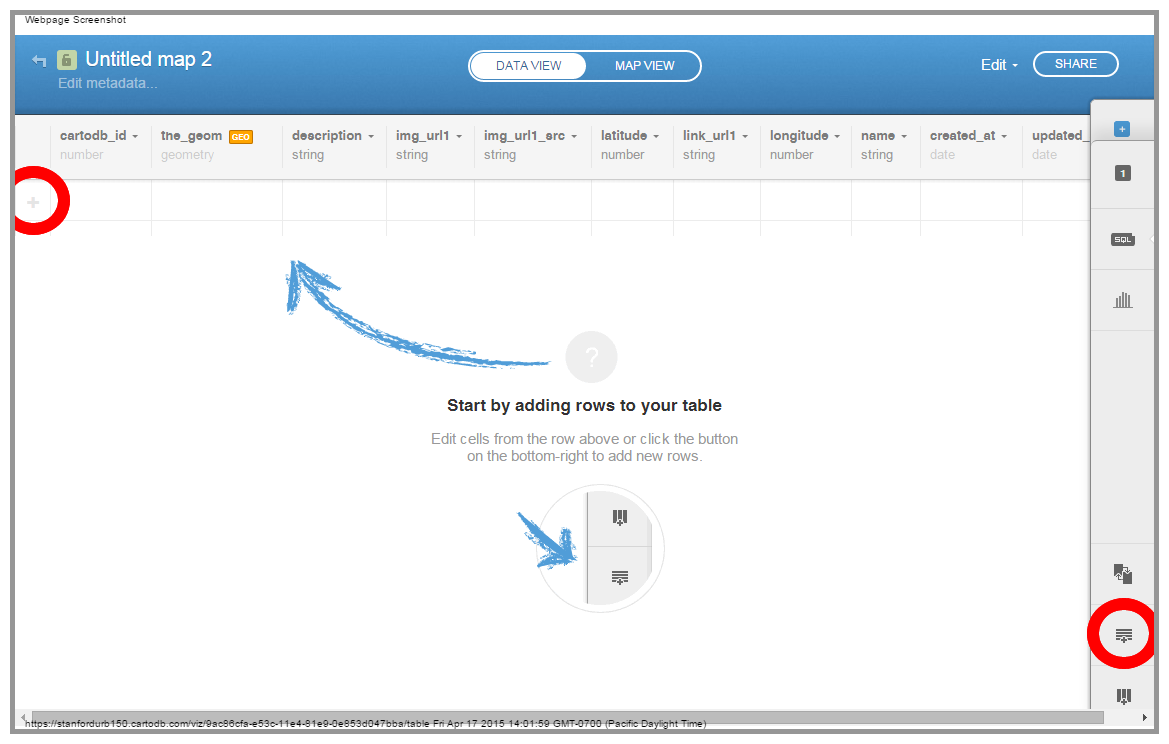
- CartoDB will tell you to start adding rows, but we're not ready for that, yet. First, we want to add some columns to hold the content we want in our pop-ups and hoveer actions. Click on the Add Columns button, instead...
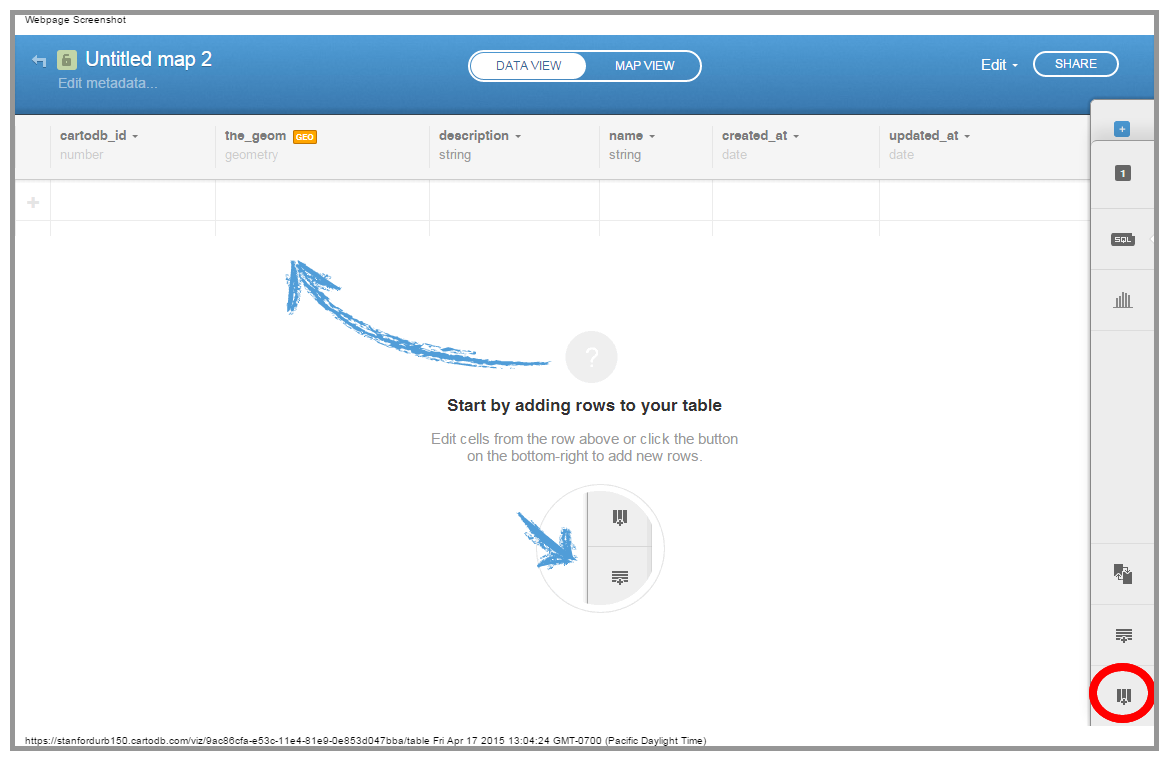
- Our blank table already has description and name fields, so we don't need to add those. We do want to add images to our pop-ups, as well as links our image sources and maybe even links to other websites with more information on the subject of the points we input. Let's add columns for those...
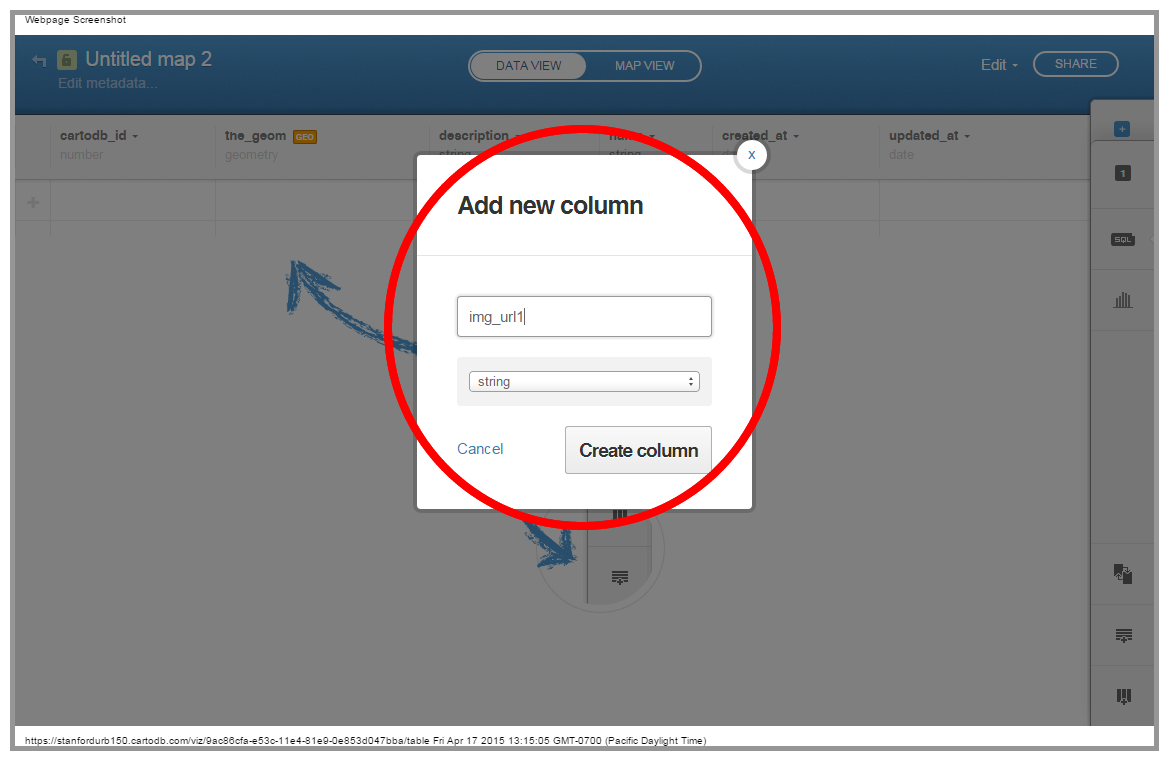
Add the following columns using the Add new column dialog box (just click the Add Column button again for each one):
- 'img_url1' with a type of 'string' (this will hold the URL for the image you want to show up in your pop-up)
-
'img_url1_src' with a type of 'string' (to hold the URL of the website you got the image from)
- If you want more than one image per pop-up, just add more sets of 'img_url#' and 'img_url#_src' columns, iterating the number (not too many, though, you'll be able to insert images into the narrative text of your Odyssey.js Story Map)
-
'link_url1' with a type of 'string' (This will hold a URL to link out to other sources of information)
- Again, if you want more links, just iterate the 'link_url#' column
- 'latitude' with a type of 'number'
- 'longitude' with a type of 'number'
Entering Your Data!
Now it's time to start putting some content into your CartoDB table. Hopefully, you've already assembled the materials you need and can simply begin to cut-&-paste that data into your table.
- First, click on either of the Add Row buttons at the left side of the first empty row, or at the bottom right of the table, right above the Add Column button.
- Now simply double-click in the cell you want to / and cut-&-paste the data for your locations into the table.
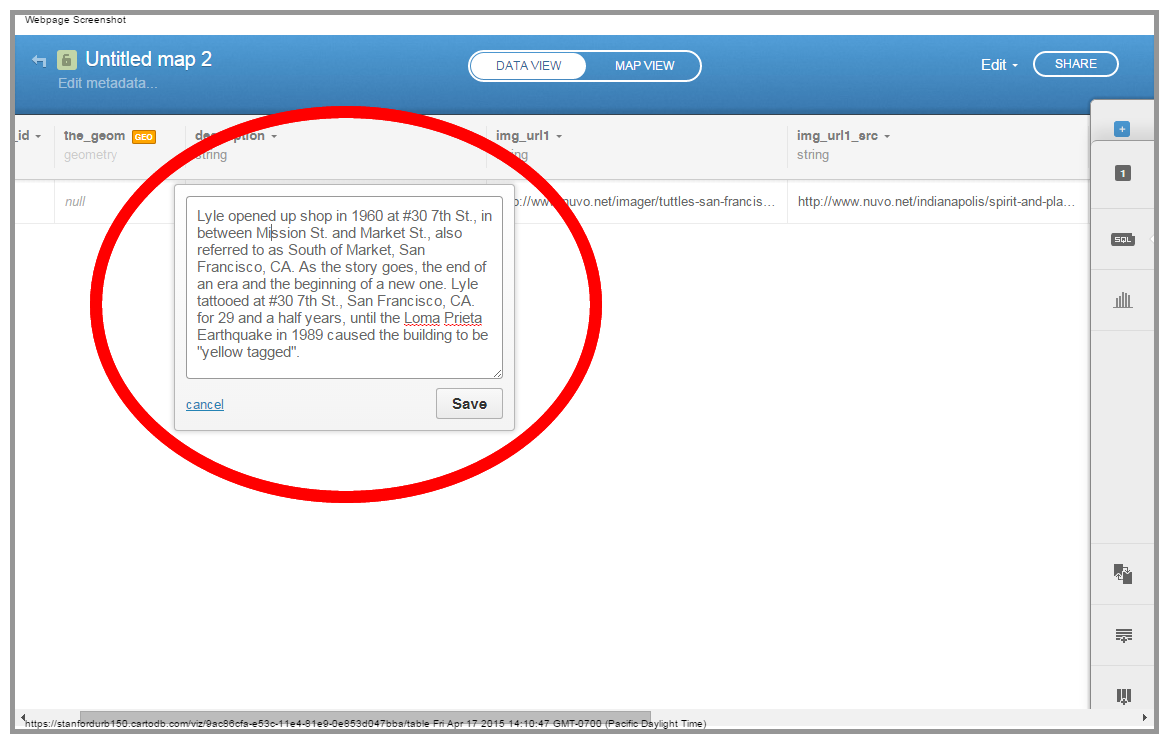
Now all you need to do is repeat the process for all of your locations!
Geocoding Your Locations (making them show up on the map)
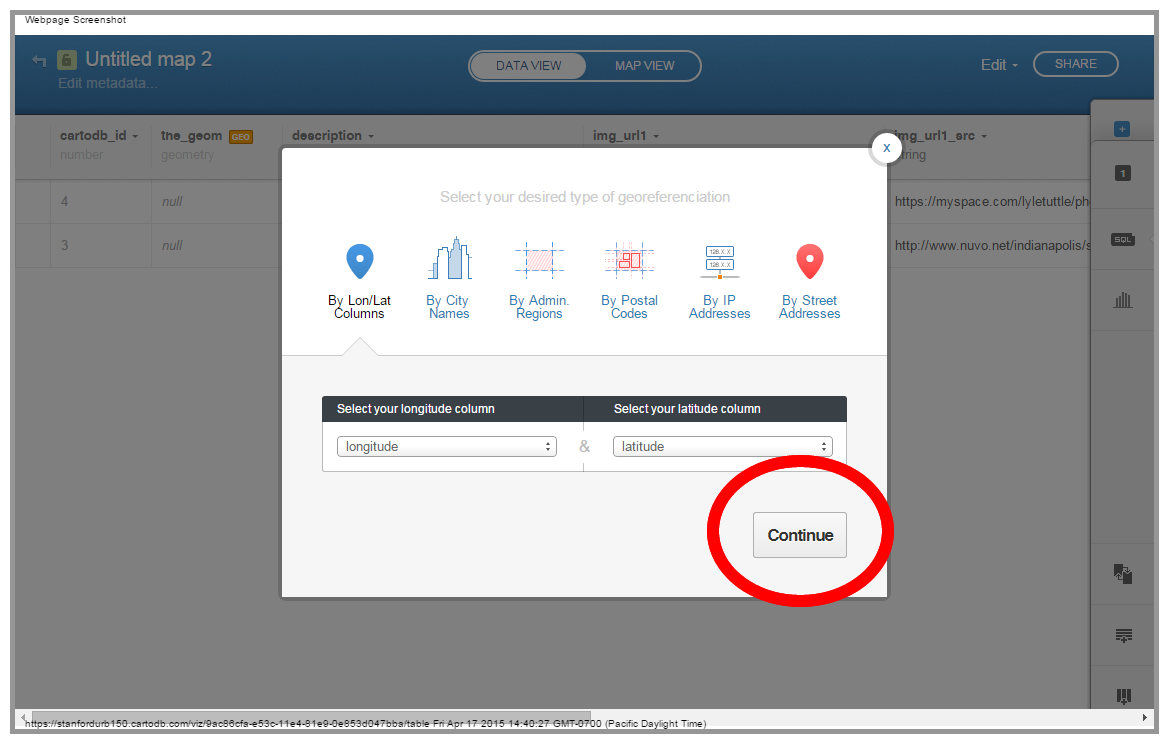
Once you have finished entering all of your data, you need to tell CartoDB that your 'latitude' & 'longitude' fields contain the geographic information about your locations. This will create geometry data in the default column, 'the-geom'.
- Click on the orange GEO button, to the right of the name of the 'the_geom' column

- CartoDB should guess that your coordinate columns are called 'longitude' & 'latitude'
- Click Continue
You may have noticed that we could have simply placed street addresses into our table and 'geocoded' our data that way. We used coordinate for two reasons:
- First, geocoding street addresses in CartoDB comes with a quota, geocoding with coordinates doesn't...
- Second, we're mapping historical locations/addresses that might not necessarily be the same, now, as they were, historically. Streets change names, disappear and are created through time.
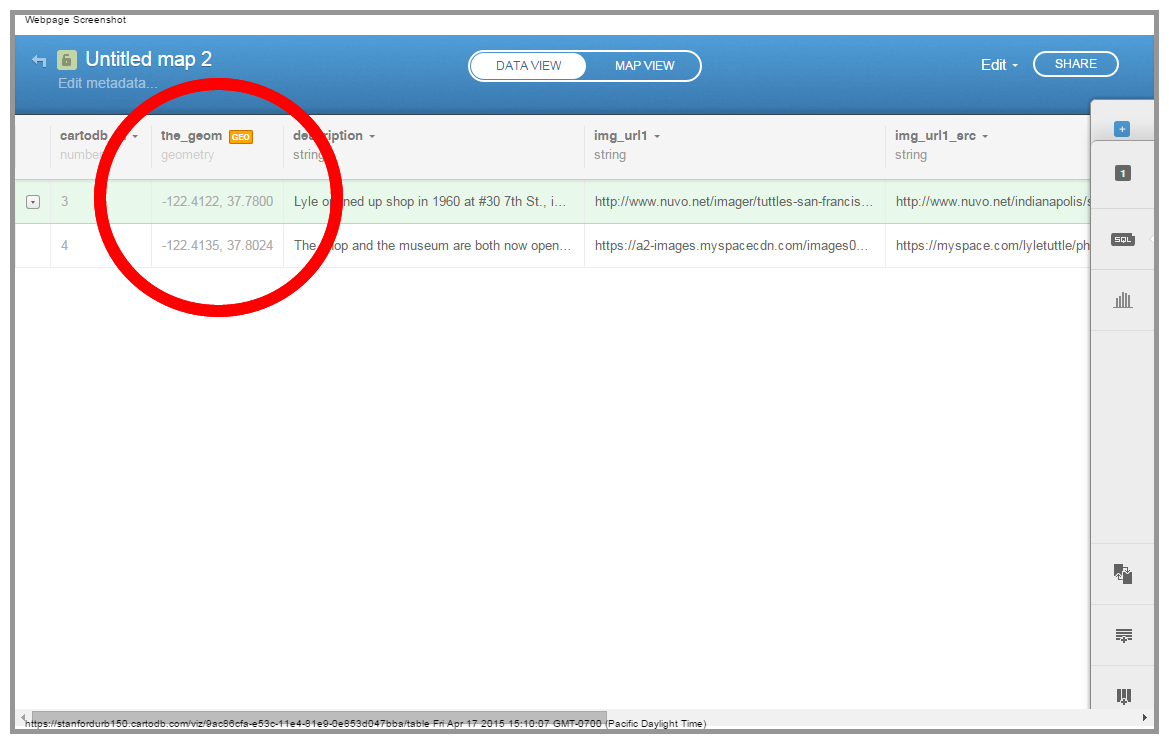
- That's it! You should see your coordinates in the 'the_geom' column, now!
- Click on the MAP VIEW button at the top and center of the page to see your locations appear on the map.
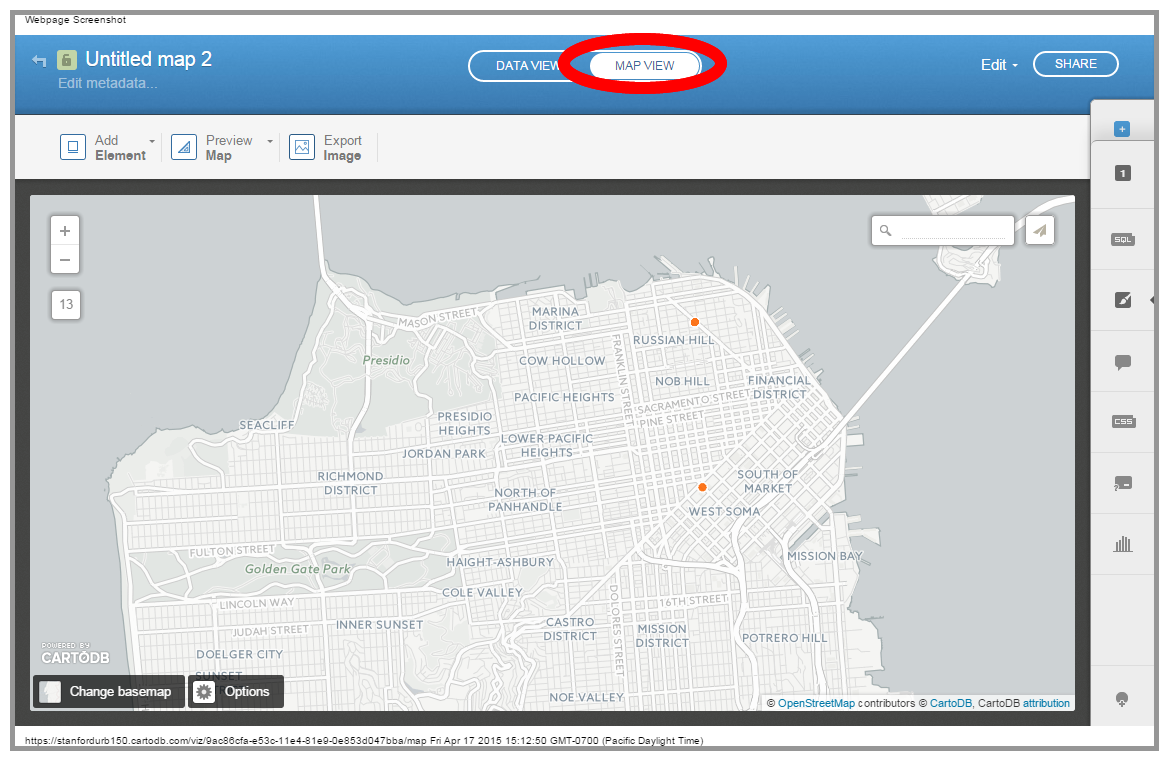
Ok. You've got a CartoDB map, now. We're not going to go into creating custom symbols, etc... since you can just go the the CartoDB Academy page (see the top of this page) and get all of that. We're just going to stick with the default symbol for this tutorial.
Customizing the Click & Hover Pop-ups
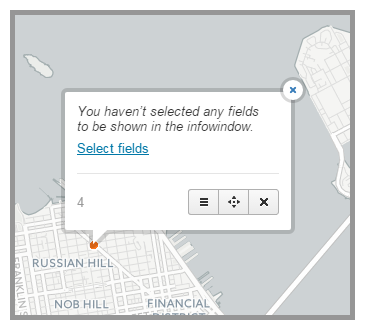
Now we want to do a little culstomization of the pop-ups that will appear when you click or hover on the points in your map. Notice that, right now, nothing happens when you hover over a point, and you get a message that "You haven’t selected any fields to be shown in the infowindow." when you click on a point. Now is time to fix that, but we're going to go beyond just showing the fields we've entered, since they are just URLs and not terribly interesting.
- Click on the infowindow button to open the CartoDB control panel at the right side of the page.
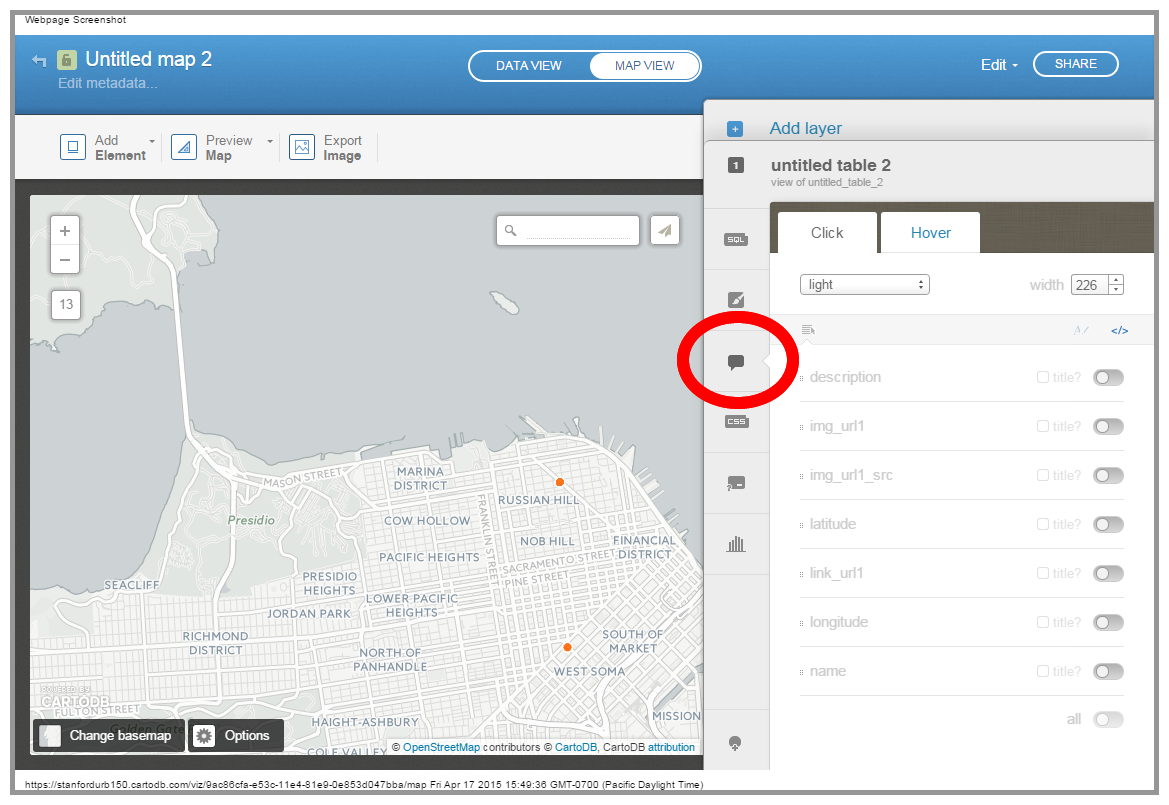
- Click on the header dropdown and select the image header type
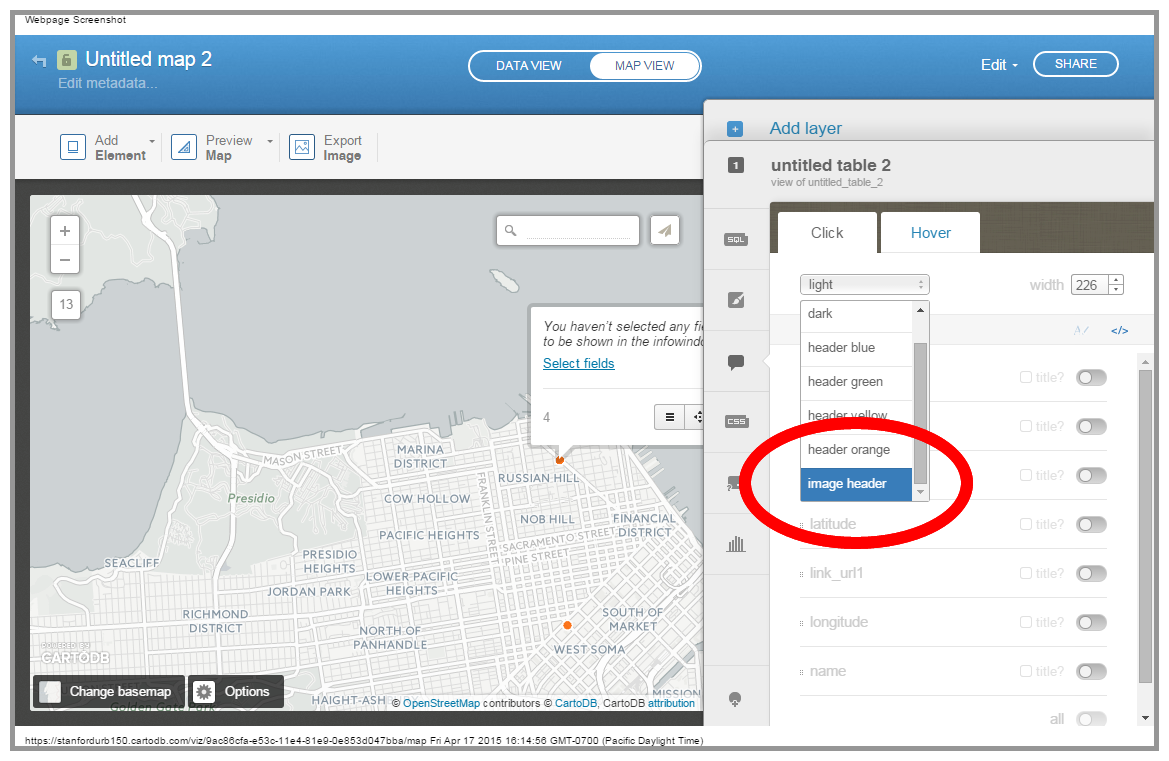
- Use the switches to turn on all but the latitude & longitude fields for display in the pop-up
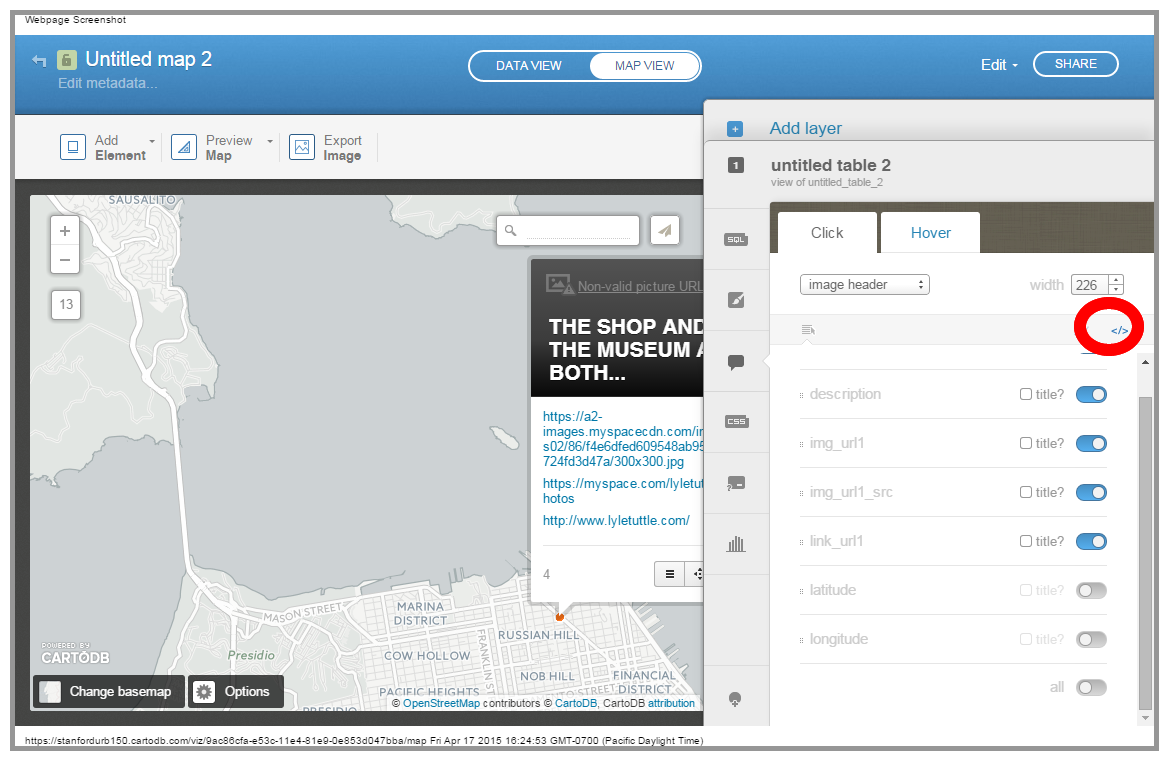
- Toggle all of the title checkboxes off
-
Drag-and-Drop the enabled fields to reorder them so that they are ordered like so:
- name
- description
- link_url1
- Now, click on the Change HTML link at the top right of the Cick pop-up panel
-
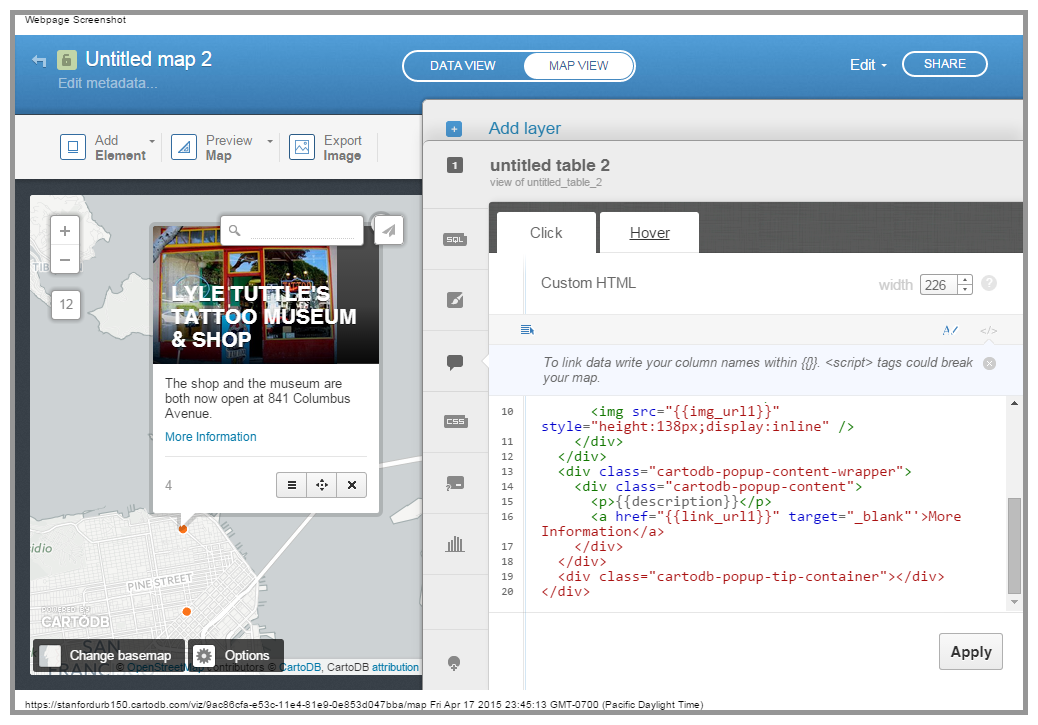
Find the following code:
<h1 class="order1">{{description}}</h1>And replace it with:
<h1 class="order1">{{name}}</h1>and click Apply
This should change the text in the pop-up header to the name value you put in the corresponding column.
- Find the following code:
<img src="{{name}}"
- And replace it with:
<img src="{{img_url1}}"
- and click Apply
This should replace the current error message in the header with the image for which you placed the URL in your 'img_url1' column.
- Finally, find the following code:
<p>{{link_url1}}</p>
- And replace it with:
<a href="{{link_url1}}" target="_blank"'>More Information</a>
- and click Apply
A Little More Work
You can customize your CartoDB map a bit more, now, using the Options button, etc... I suggest at least setting the options for Scroll Wheel Zoom.
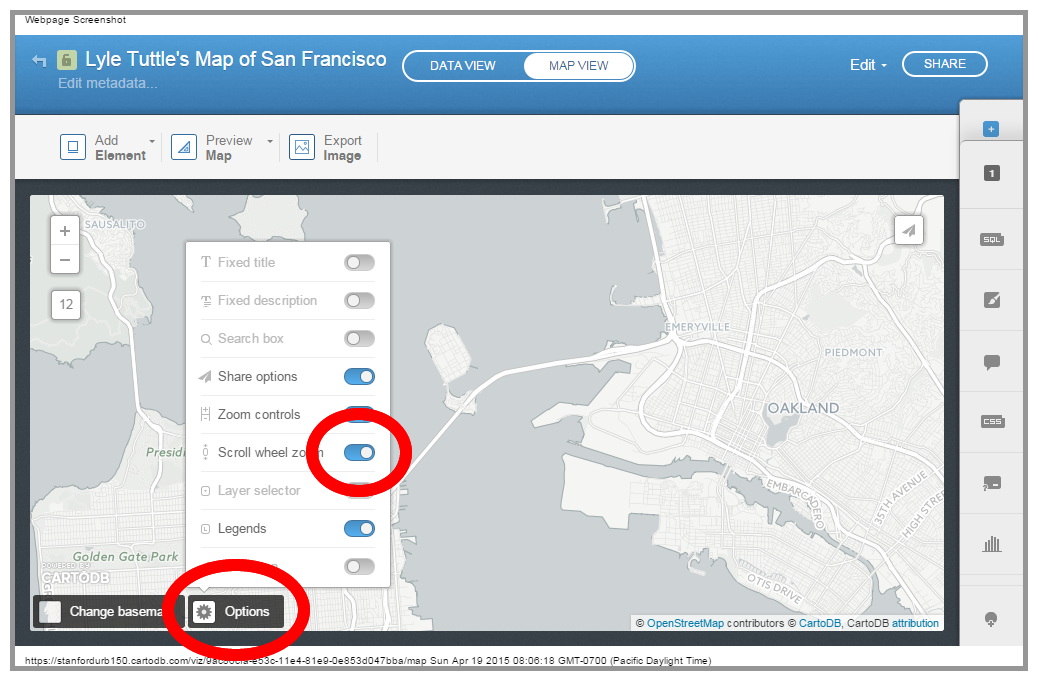
That's it! We're now ready to switch gears to create a Story Map with Odyssey.js
You can find my Tattoo map at: http://cdb.io/1FXtGQ9
Creating a Story Map with Odyssey.js
Now that you've created the data for your story map, you're ready to go and build the narrative/navigation part of your application. We're going to use Odyssey.js for this. Odyssey.js is actually a JavaScript library that you can use on your own web server, but CartoDB has implemented a Sandbox that allows non-programmers to deploy a story map with very little coding and without any web server infrastructure, at all. Odyssey.js uses a very simple text matkup language called Markdown. This entire tutorial is actually written in Markdown, which allows Github to render the lists, HTML links and other elements.
Choosing an Odyssey.js Template
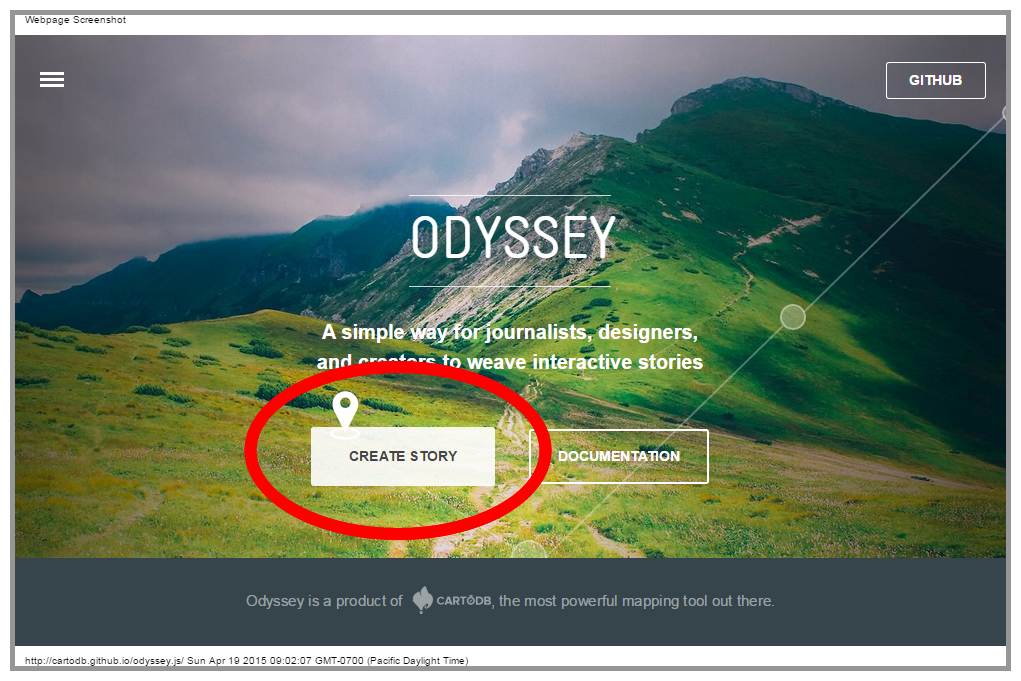
- First, go to http://cartodb.github.io/odyssey.js/ and click on the Create Story button
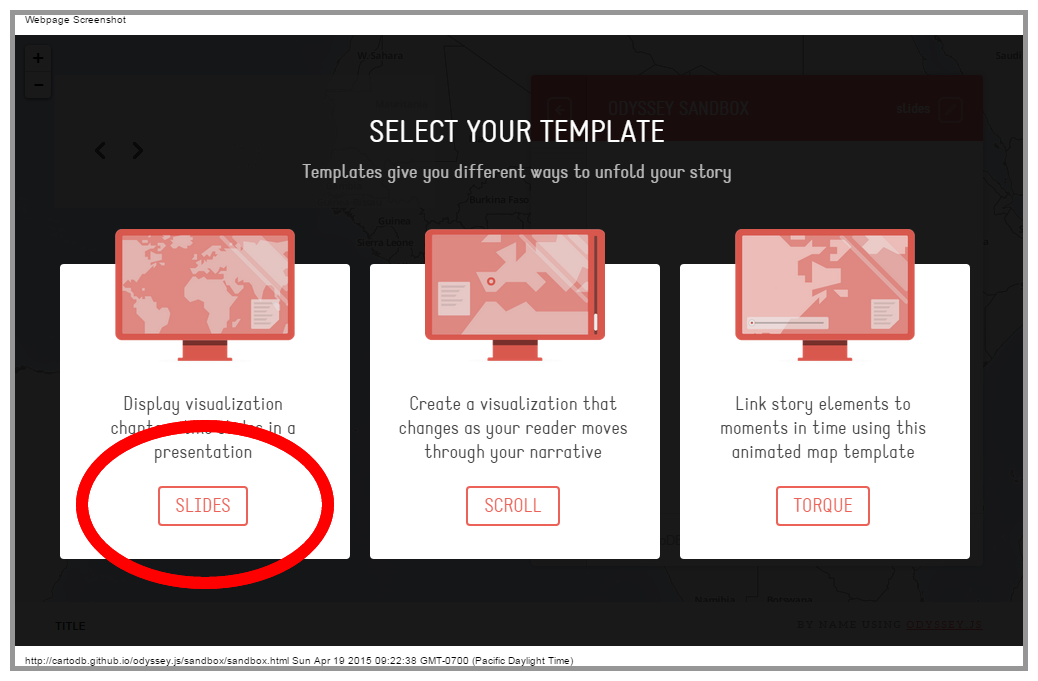
- Now, select the Slides Template
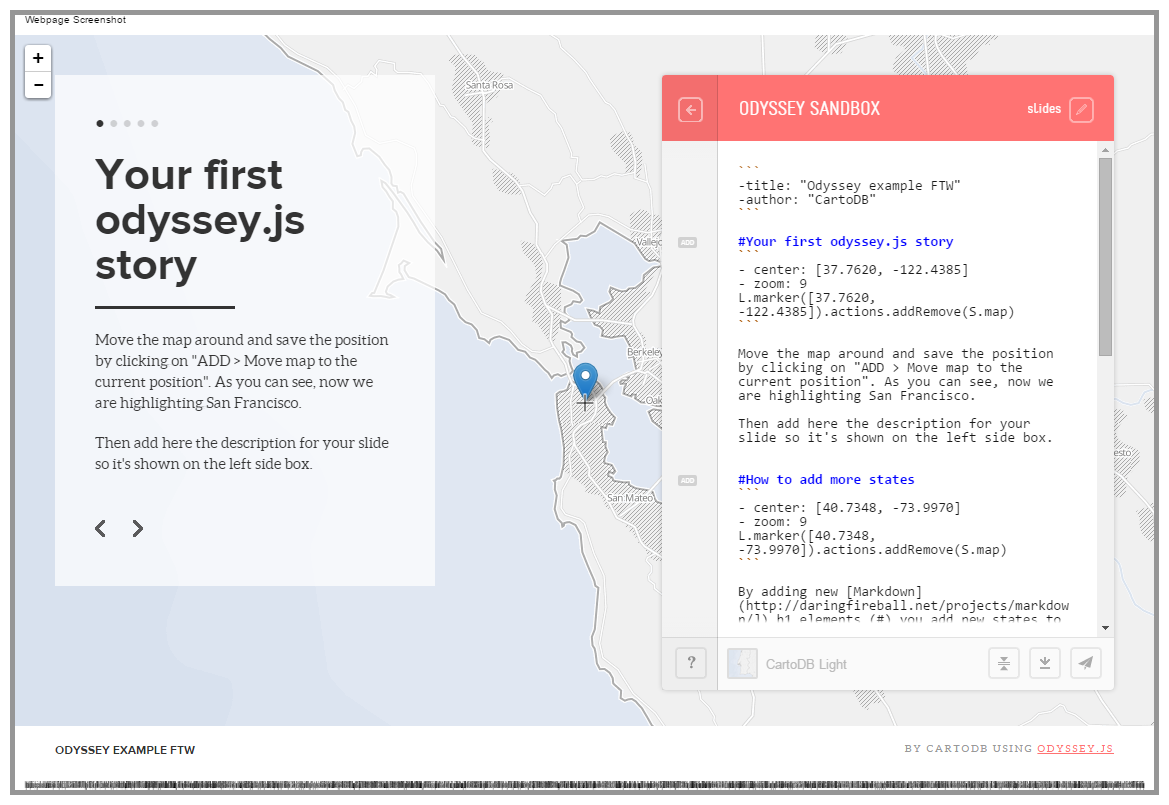
You should now see the Odyssey.js Sandbox template for a slideshow style story map. Note that you will be editing in the panel labeled Odyssey Sandbox and your edits will change the look of the content panel on the left, as well as the map. The Odyssey Sandbox panel will not be visible in the final story map.
Customize the config block of Your Odyssey.js Applicaiton
- At the top of the Oddysey Sandbox* panel, you should see two lines of text that look like this:
    ```
    -title: "Odyssey example FTW"
    -author: "CartoDB"
    ```
- Go ahead and customize it so that it reflects the title and author for your project:
    ```
    -title: "The Tattoo Map of San Francisco"
    -author: "Stace Maples"
    ```
Bringing your CartoDB Visualization into Odyssey.js
The first thing we want to do is bring the CartoDB Visualization we created into the Odyssey.js application. We're going to use the vizjson option in the config block of your Odyssey.js markdown. First, you will need the JavaScript API URL of your visualization.
- Return to the CartoDB page for your visualization and click on the Share button
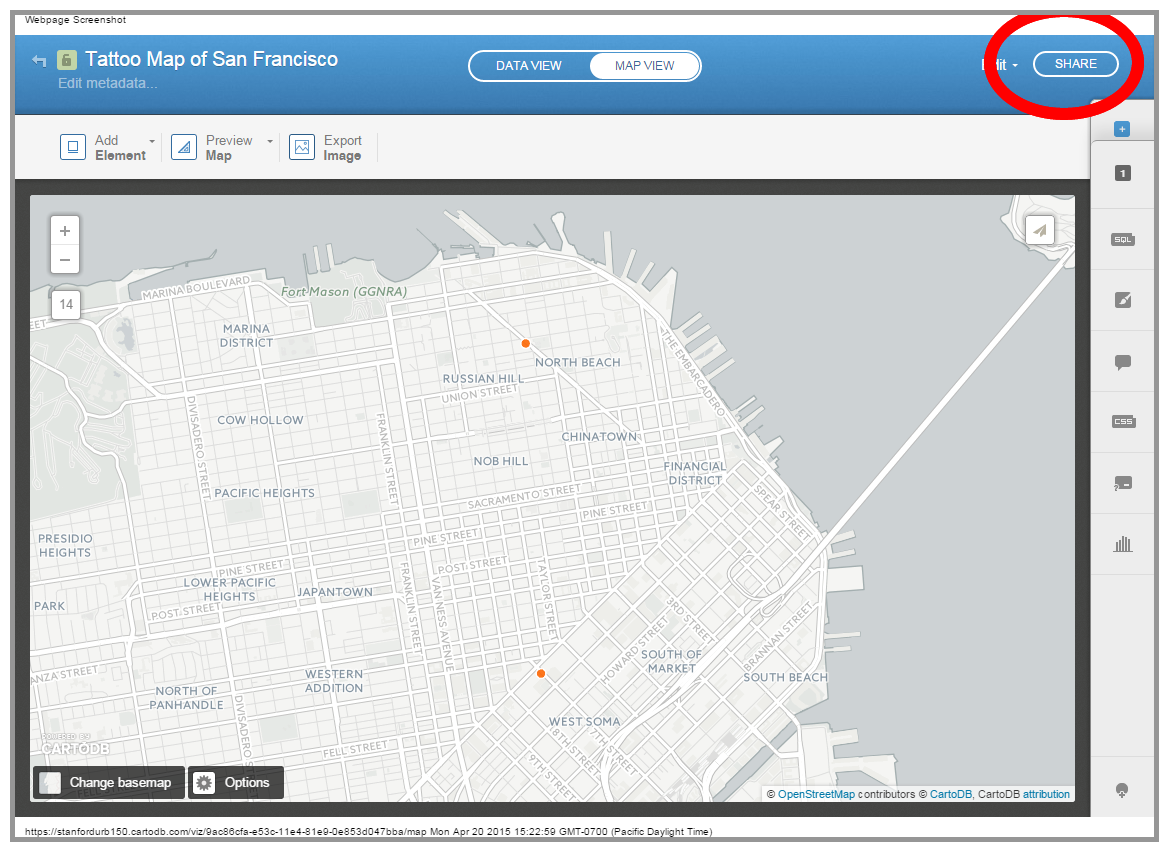
- Click on the Copy button under the CartoDB.js panel to copy your CartoDB.js API URL
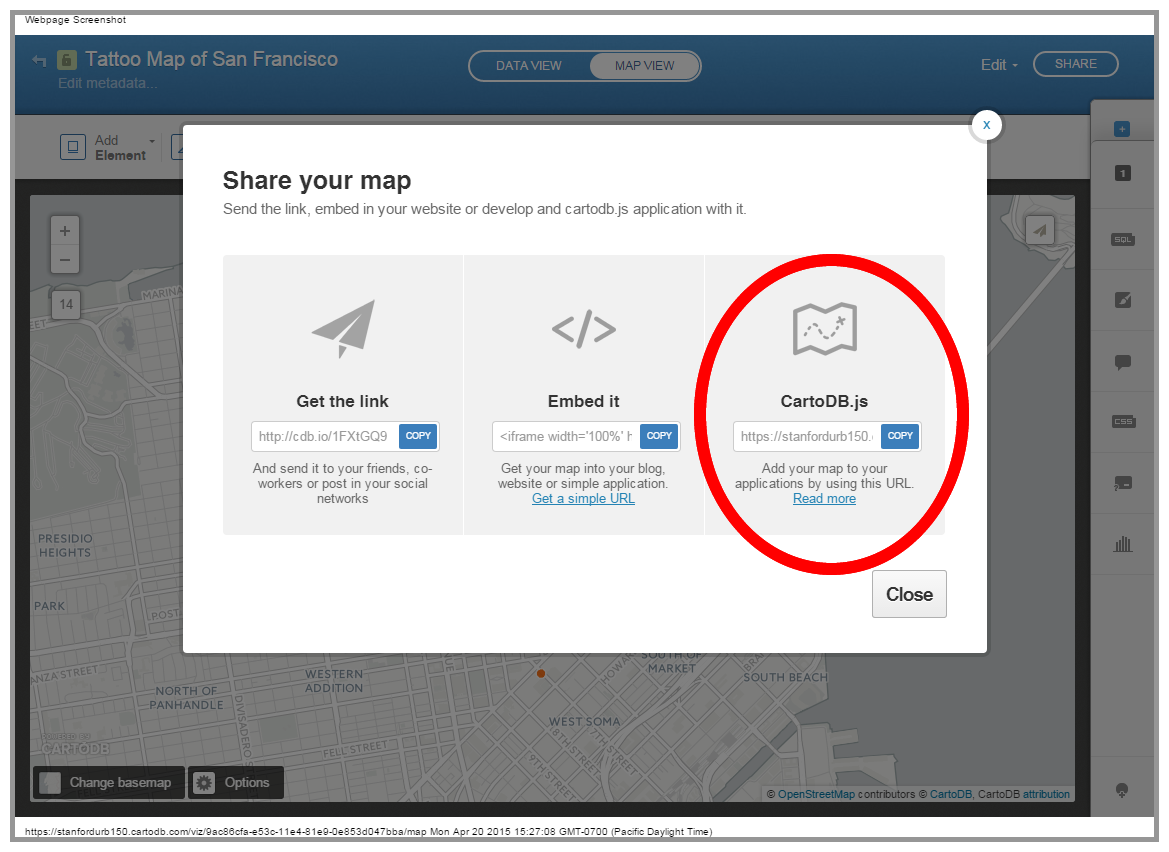
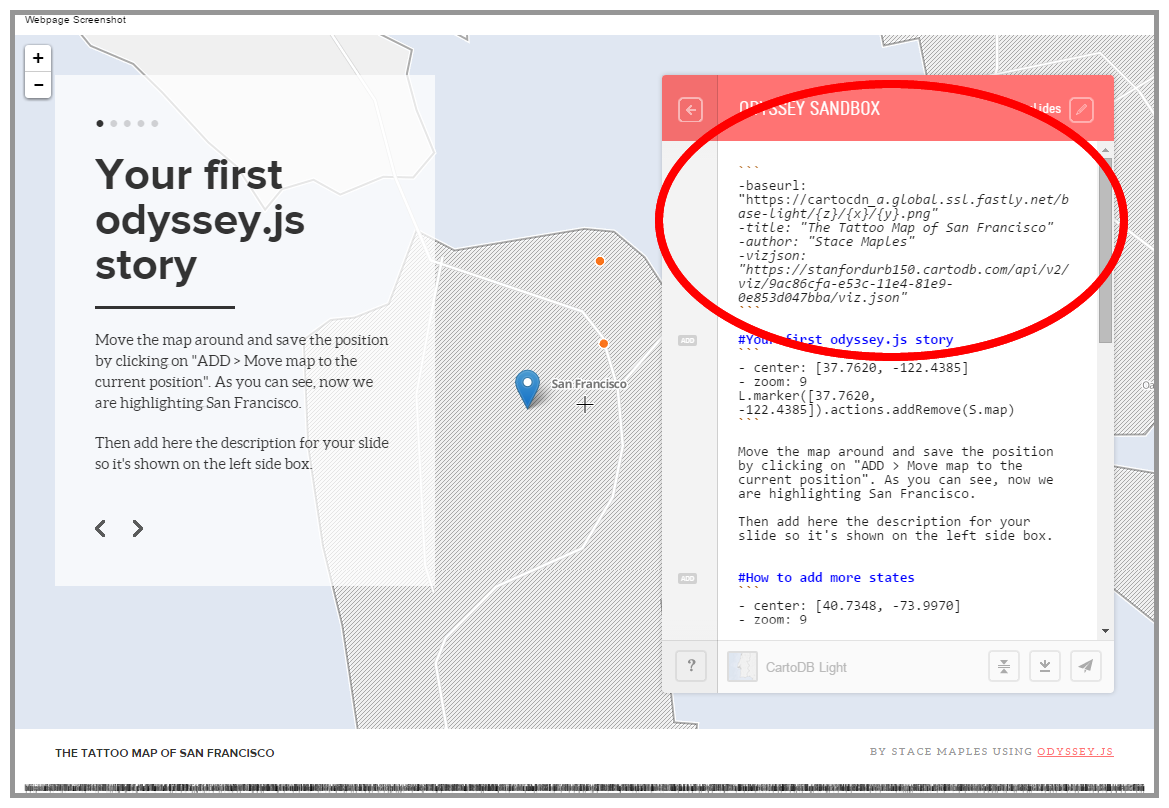
- Return to the Odyssey Sandbox and paste 'vizjson: "Your CartoDB.js API URL"' with your CartoDB.js API URL into the config block, so that it now looks something like this:
    ```
    -title: "The Tattoo Map of San Francisco"
    -author: "Stace Maples"
    -vizjson: "https://stanfordgeo.cartodb.com/u/stacemaples/api/v2/viz/7840fa14-e940-11e4-bb41-0e49835281d6/viz.json"
    ```
Note that the data points from your CartoDB visualization should now be visible in your map.
Adding a Slide to Your Story Map
Now you're ready to start adding the content of your slides to the Oddysey.js Sandbox. Now is a good time to review a little bit about the Markdown language that drives the Odyssey.js application. As mentioned above, Markdown is a text markup language that acts a bit like shorthand for writing HTML code. Markdown simplifies the process of creating HTML text formatting, add ing images, links and other content to a page meant for the web. This entire tutorial is written in Markdown. Odyssey.js uses Markdown in thhe way it is intended (to format text and content) with one important exception. The H1 Heading element is used by Odyssey.js to signal the beginning of a "new slide." You can see this in the Odyssey.js Sandbox if you count the number of dots at the top of the content panel on the left, and then count the number of lines in the ODYSSEY SANDBOX panel on the right that begin with the # symbol. Same number! Each H1 Header line in the Sandobox define the begining of a new slide, as well as the Title text of that slide.
Here are a few more important bits of Markdown syntax:
Headers
# Level 1 (H1) Header, also indicates the beginning of a new slide in Odyssey.js
## Level 2 Header
### Level 3 Header
And will render like this:
Level 1 (H1) Header, also indicates the beginning of a new slide in Odyssey.js
Level 2 Header
Level 3 Header
Paragraph Text
Paragraph text is just paragraph text. You can **bold** text or use *italics*. Those are the most common uses and they end up looking like this:
Paragraph text is just paragraph text. You can bold text or use italics. Those are the most common uses and they end up looking like this.
Lists
1. This
2. Is
3. An
4. Ordered
5. List

* This
* Is
* A
* Bullet
* List
Which renders like this:
1. This
2. Is
3. An
4. Ordered
5. List
- This
- Is
- A
- Bullet
- List
Links
Create Links like this: [Google](http://google.com)
Which Renders like this: Google
Images
You can place an image like this:

Which will render like this:

That's as far as we are going to dive into Markdown for this tutorial, but there is loads more you can do with it. If you want' to find out more, go to http://daringfireball.net/projects/markdown/syntax
Making Your First Odyssey.js Slide
Ok, time to create your first Story Map slide.
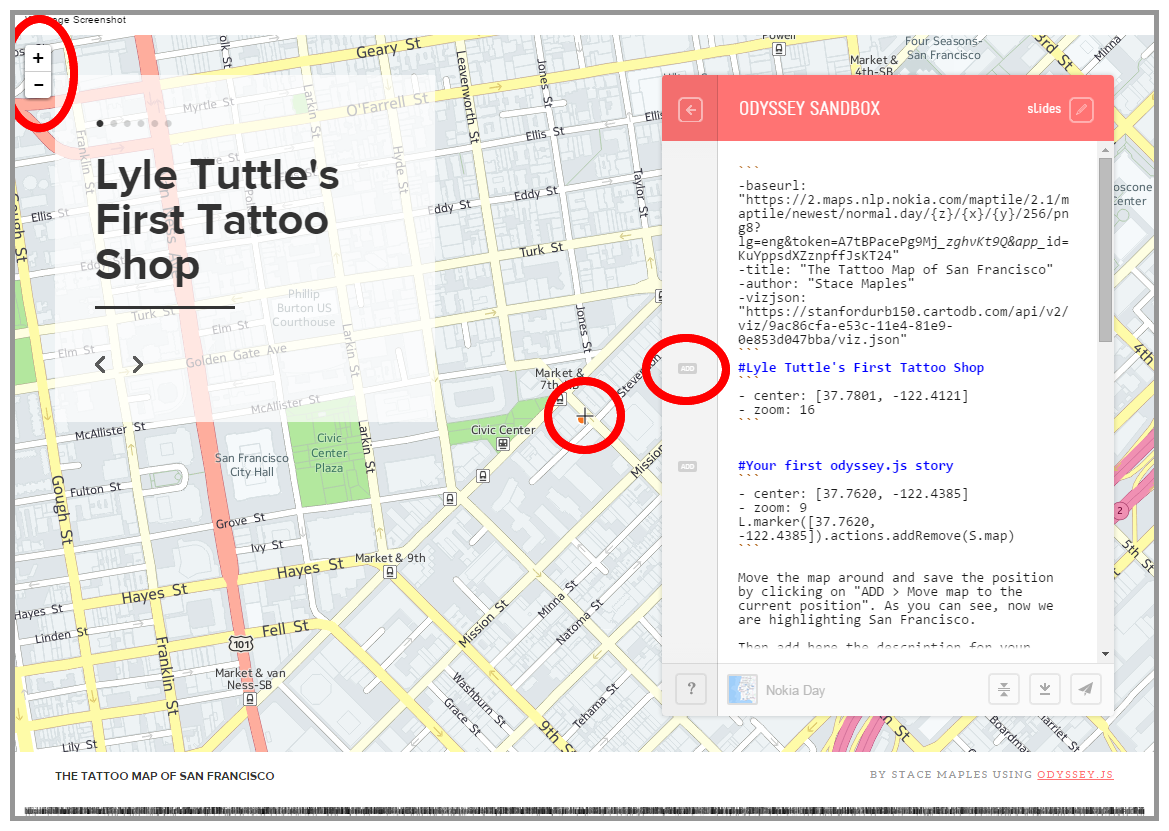
- Return to the Odyssey Sandbox and place your curser on the blank line just above the deafult first slide H1 header and add the Title Text you want for your first slide, like this:
#Lyle Tuttle's First Tattoo Shop
- Hit Enter
- Now position the map so that the crosshair in the center of the screen is directly above the location you want to highlight. Use the Zoom tool to change the scale of the map, until you are happy with the view.
- Notice that when you created the H1 header for your slide, a little ADD button appeared to the left of it in the Odyssey Sandbox. Click on that ADD button to snapshot the view for the slide. Select the option to move map to the current position.
Add more slides!
Now that you know how, you can delete the Sandbox Markdown below your first slide and add all of the slides you want! Insert Images, etc...
Using a Georeferenced Map from DavidRumsey.com as Your Basemap
It's possible to change the basemap of your Odyssey.js Story Map, either using the Basemap Selector at the bottom of the Sandbox panel, or by adding a bit of code to the config block. This is a bit tricky, but I will briefly explain it here.
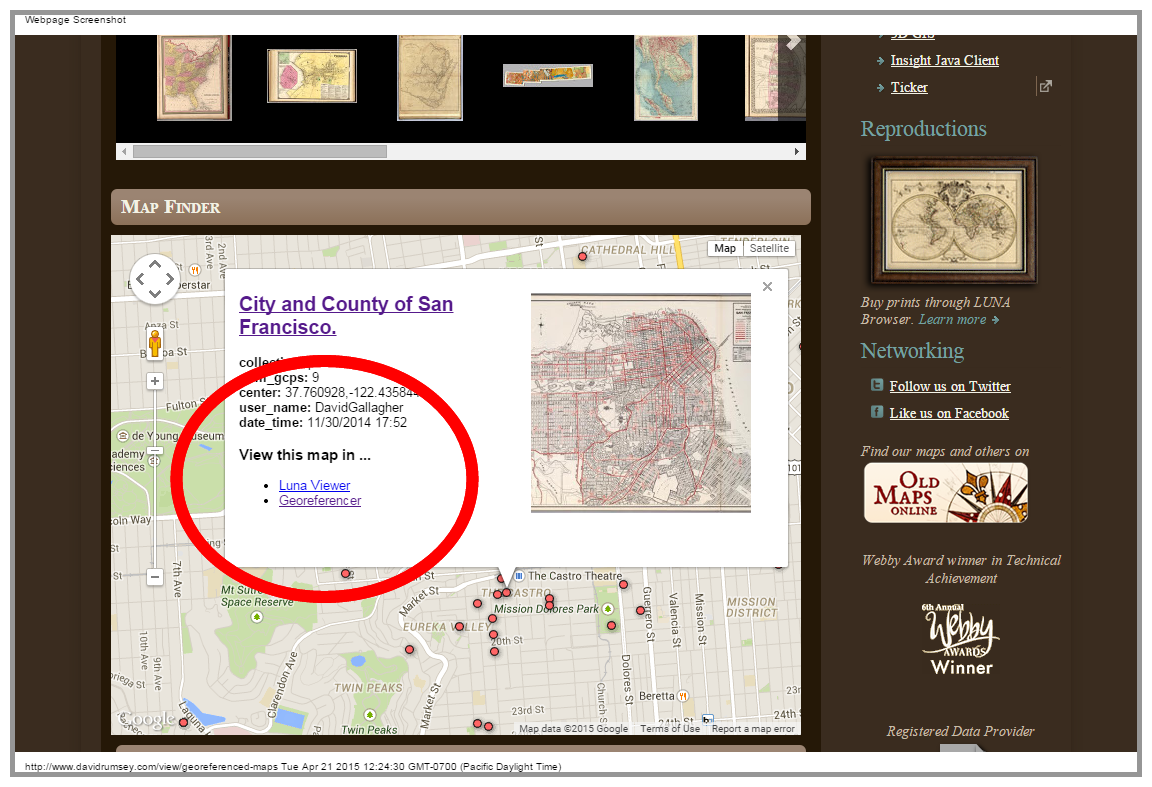
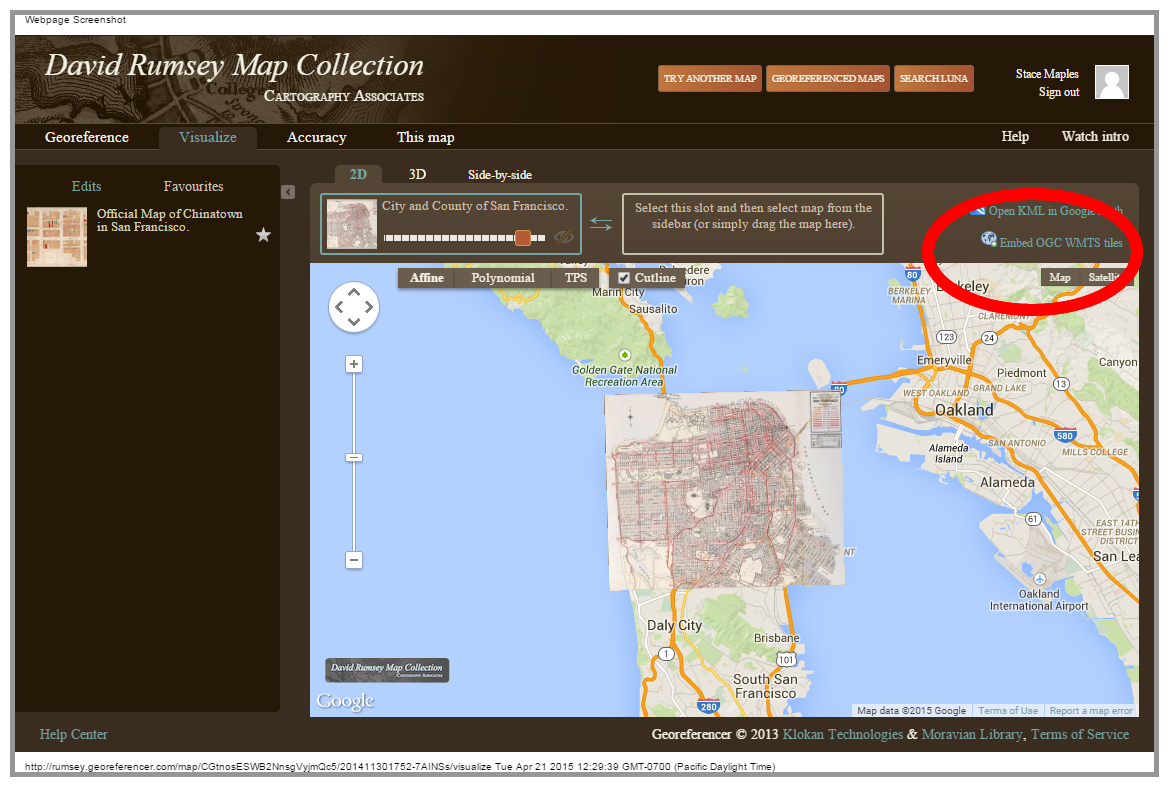
- First, go to DavidRumsey.com and find a map that is georeferenced that you can use (I won't go into the use of his georeferencer here, but you can search for any map you want and georeference it yourself). There is a Map Finder at the bottom of the page, which is currently the easiest way to locate a map for the area you want.
- Click on the dots to preview the maps, and once you find one, click on View this map in... *Georeferencer*
- Click on the Embed OGC WMTS tiles link at the top right of the map window
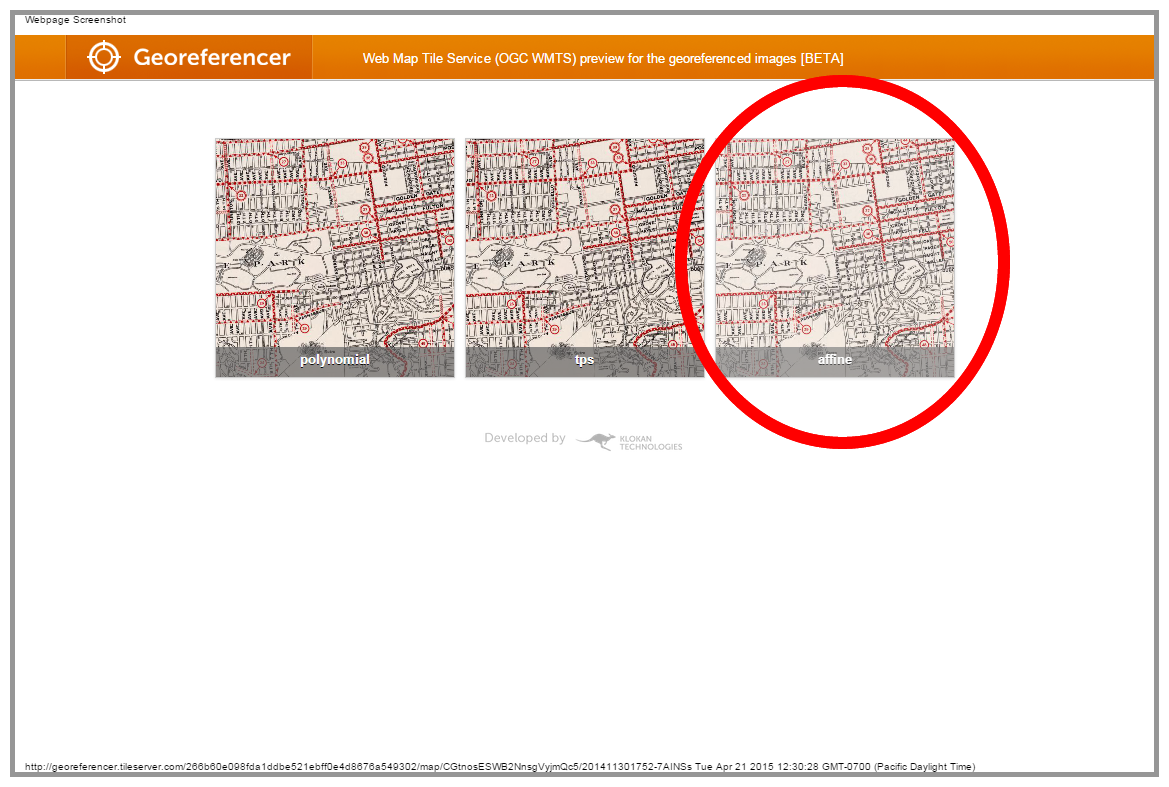
- Click on the Affine Thumbnail
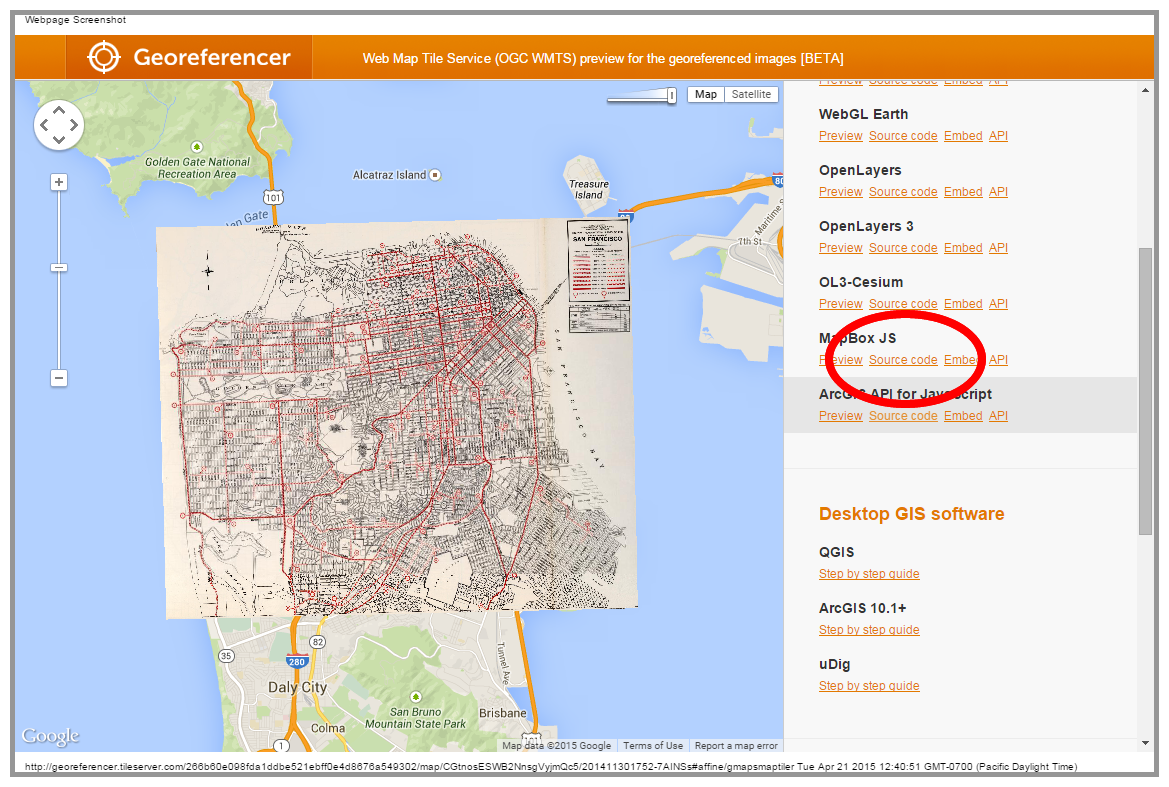
- Find the MapBox JS* Source code link on the right side of the page and click on it
- OK, here's the tricky part. It looks scarier than it is. Find the first URL for the Tile Server in the code. It should be Green. Highlight & copy that URL, with the quotes. It will look something like this:
"http://georeferencer-0.tileserver.com//266b60e098fda1ddbe521ebff0e4d8676a549302/map/CGtnosESWB2NnsgVyjmQc5/201411301752-7AINSs/affine/{z}/{x}/{y}.png"
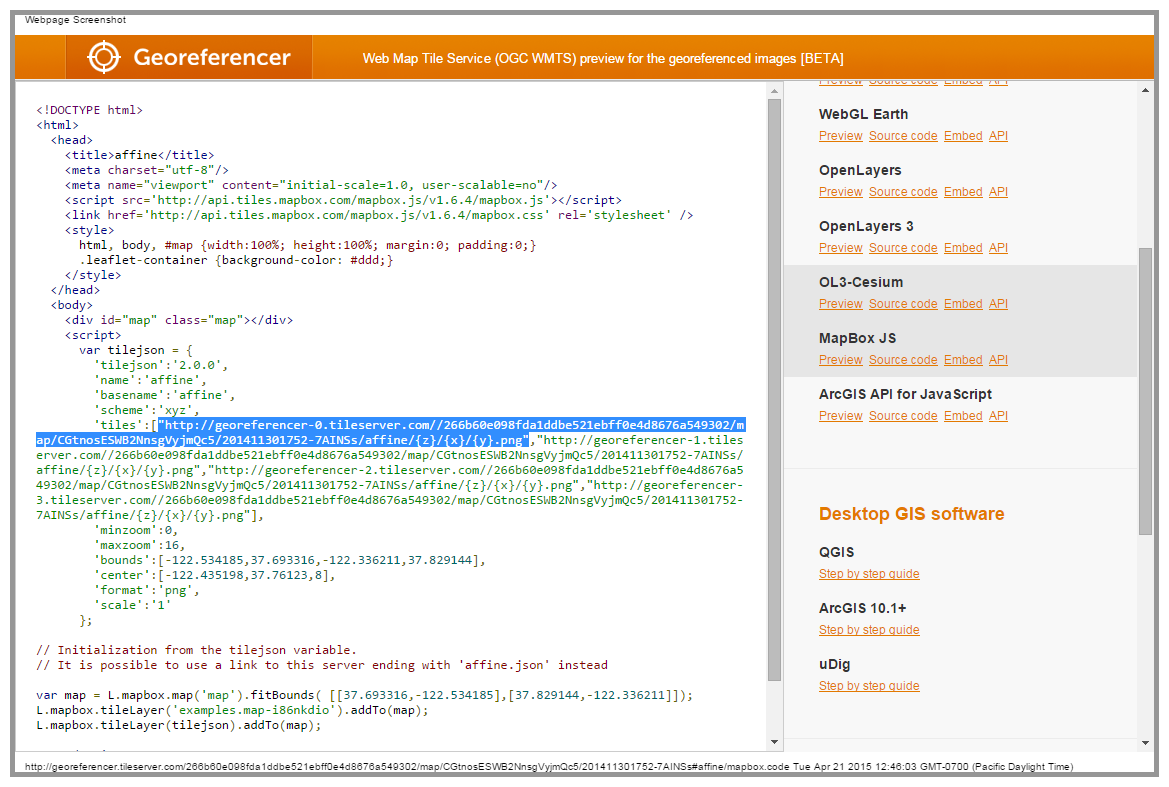
- Return to your Odyssey.js Sandbox and add the following text to your config block at the top of your Markdown code, using the URL you copied from davidrumsey.com, like this:
-baseurl: "http://georeferencer-0.tileserver.com//266b60e098fda1ddbe521ebff0e4d8676a549302/map/CGtnosESWB2NnsgVyjmQc5/201411301752-7AINSs/affine/{z}/{x}/{y}.png"
Sharing your Story Map
Once you have created all the slides you are interested in putting into your Story Map, you are ready to share your work with the world. The Odyssey.js Sandbox allows you to do this in three ways:
Sharing with an URL or Embed code
Odyssey.js can export your Story Map directly to a site called bl.ocks.org, which is just a platform for sharing and rendering JavaSript code, or give you an IFRAME code snippet to paste into your blog, or other website.
- First, click on the Share button (it looks like a paper airplane)
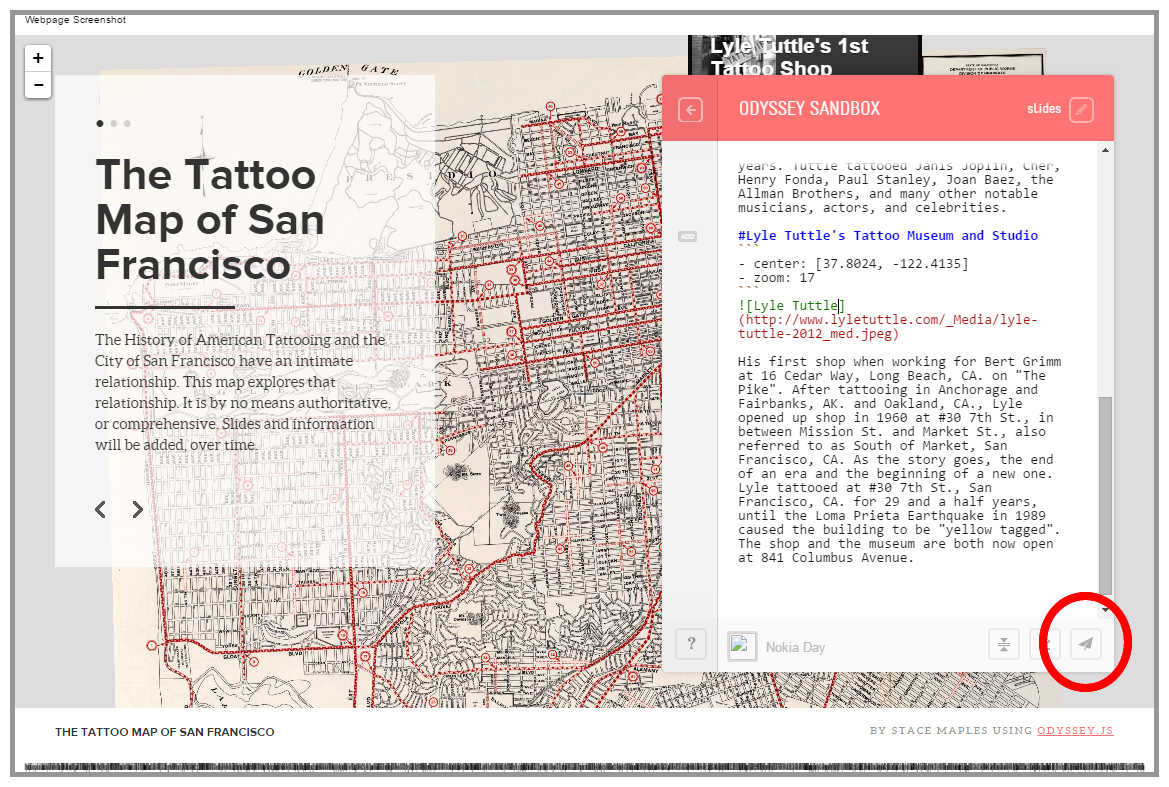
- Select whether you want to share an URL of Embed an IFRAME into an existing website, then click Copy to copy the URL or Code to your clipboard. For this tutorial, just select the URL option.
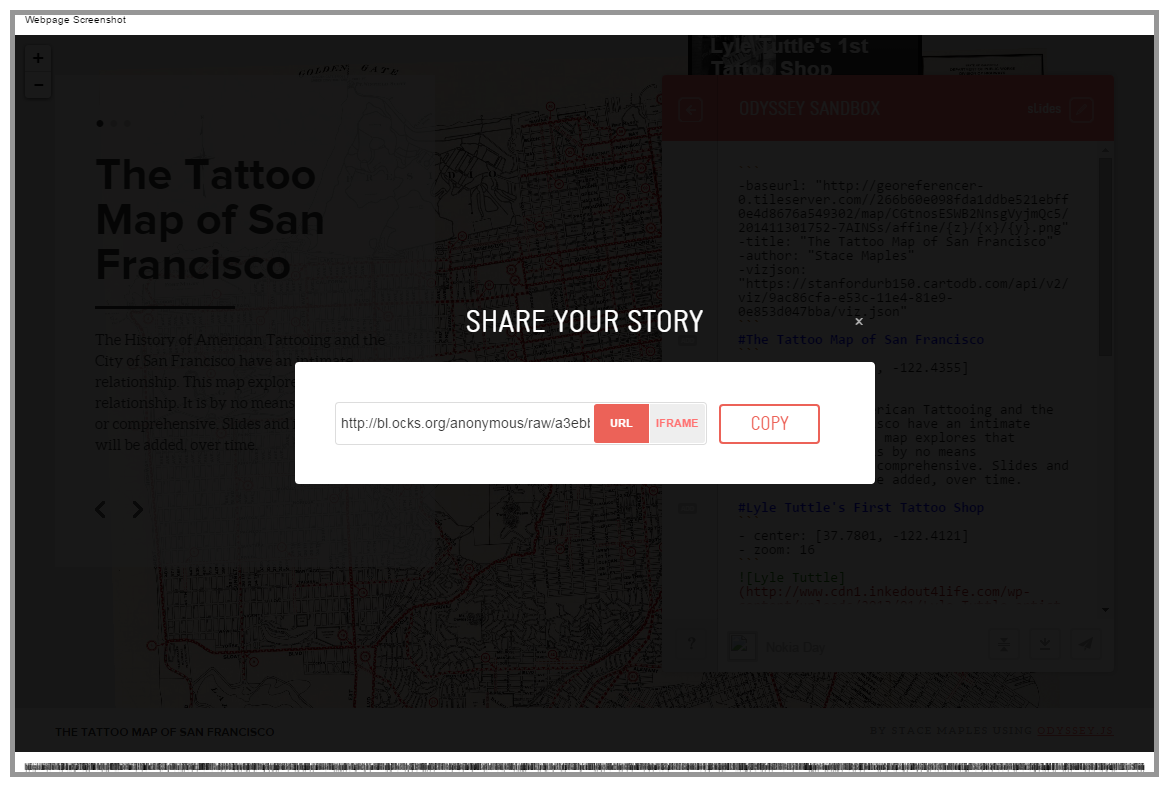
Here's the bl.ocks.org version (URL) of the tutorial map: http://bl.ocks.org/anonymous/raw/409cb9de4c713e082dee
Here's the map in my blog: http://www.stacemaples.com/tattoo-map-of-san-francisco-odyssey-js-tutorial-sample/
Downloading and Hosting Your Story Map
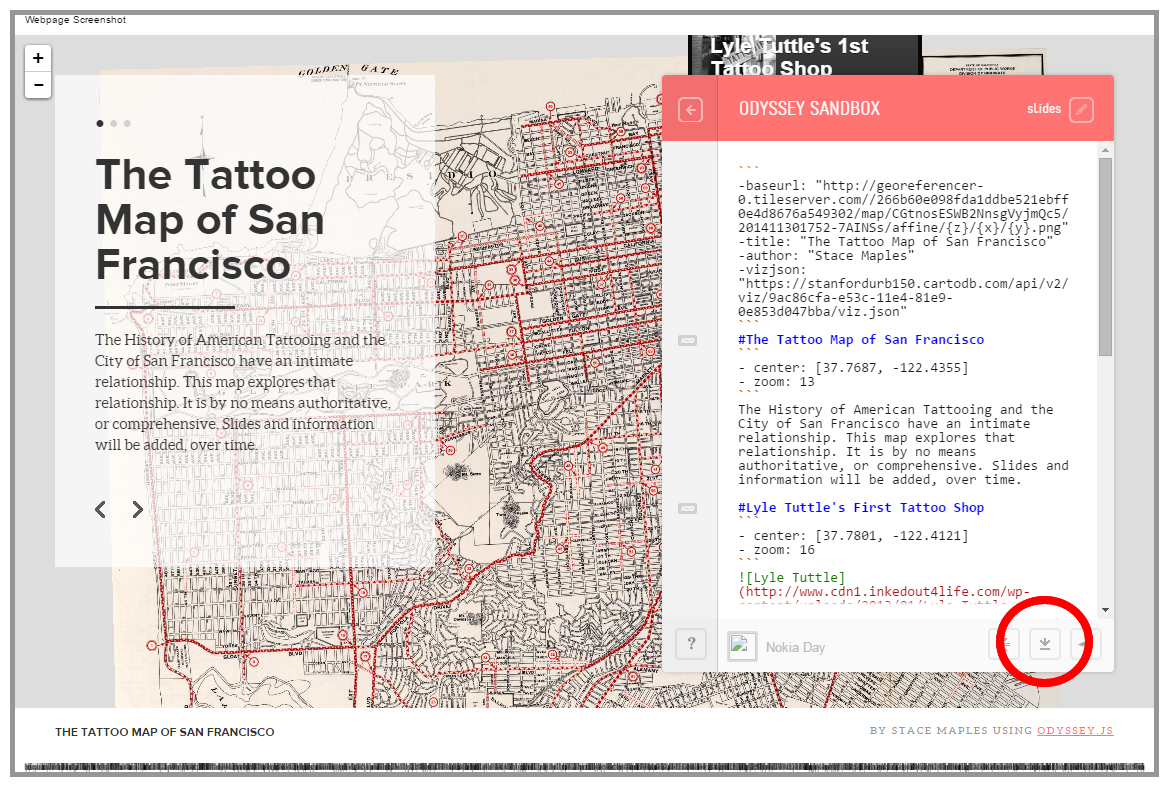
You can also download the code for your Story Map and host it on your own Web Server (provided you have one).
- Click on the Download story button in the Odyssey Sandbox panel and save the resulting .zip file to your computer.
- Extract the Odyssey.html file and copy it to your Web Server. It's ready to go! You can make customizations to the code, if you like.
Here's the map hosted on my web server: http://web.stanford.edu/~maples/maps/odyssey/odyssey.html
Here is the Markdown Code for the Sample Story Map I Just Walked Through, Above:
```
-baseurl: "http://georeferencer-0.tileserver.com//266b60e098fda1ddbe521ebff0e4d8676a549302/map/CGtnosESWB2NnsgVyjmQc5/201411301752-7AINSs/affine/{z}/{x}/{y}.png"
-title: "The Tattoo Map of San Francisco"
-author: "Stace Maples"
-vizjson: "https://stanfordgeo.cartodb.com/u/stacemaples/api/v2/viz/7840fa14-e940-11e4-bb41-0e49835281d6/viz.json"
```
#The Tattoo Map of San Francisco
```
- center: [37.7687, -122.4355]
- zoom: 13
```
The History of American Tattooing and the City of San Francisco have an intimate relationship. This map explores that relationship. It is by no means authoritative, or comprehensive. Slides and information will be added, over time.
#Lyle Tuttle's First Tattoo Shop
```
- center: [37.7801, -122.4121]
- zoom: 16
```

Tuttle was born in Chariton, Iowa in 1931 but grew up in Ukiah, California. At the age of fourteen he purchased his first tattoo for $3.50. In 1949, he began tattooing professionally.[2] In 1954 he opened his own studio in San Francisco. This first shop was open for nearly 30 years. Tuttle tattooed Janis Joplin, Cher, Henry Fonda, Paul Stanley, Joan Baez, the Allman Brothers, and many other notable musicians, actors, and celebrities.
#Lyle Tuttle's Tattoo Museum and Studio
```
- center: [37.8024, -122.4135]
- zoom: 17
```

His first shop when working for Bert Grimm at 16 Cedar Way, Long Beach, CA. on "The Pike". After tattooing in Anchorage and Fairbanks, AK. and Oakland, CA., Lyle opened up shop in 1960 at #30 7th St., in between Mission St. and Market St., also referred to as South of Market, San Francisco, CA. As the story goes, the end of an era and the beginning of a new one. Lyle tattooed at #30 7th St., San Francisco, CA. for 29 and a half years, until the Loma Prieta Earthquake in 1989 caused the building to be "yellow tagged". The shop and the museum are both now open at 841 Columbus Avenue.
```
And, the code for the Custom HTML Popup in CartoDB:
<div class="cartodb-popup header with-image v2" data-cover="true">
  <a href="#close" class="cartodb-popup-close-button close">x</a>
  <div class="cartodb-popup-header">
    <div class="cover">
      <div id="spinner"></div>
      <div class="image_not_found"> <i></i> <a href="#/map" class="help">Non-valid picture URL</a></div>
      <span class="separator"></span>
      <h1 class="order1">{{name}}</h1>
      <div class="shadow"></div>
      <img src="{{img_url1}}" style="height:138px;display:inline" />
    </div>
  </div>
  <div class="cartodb-popup-content-wrapper">
    <div class="cartodb-popup-content">
      <p>{{description}}</p>
      <a href="{{link_url1}}" target="_blank"'>More Information</a>
    </div>
  </div>
  <div class="cartodb-popup-tip-container"></div>
</div>